
homeobox B9a
ZFIN 
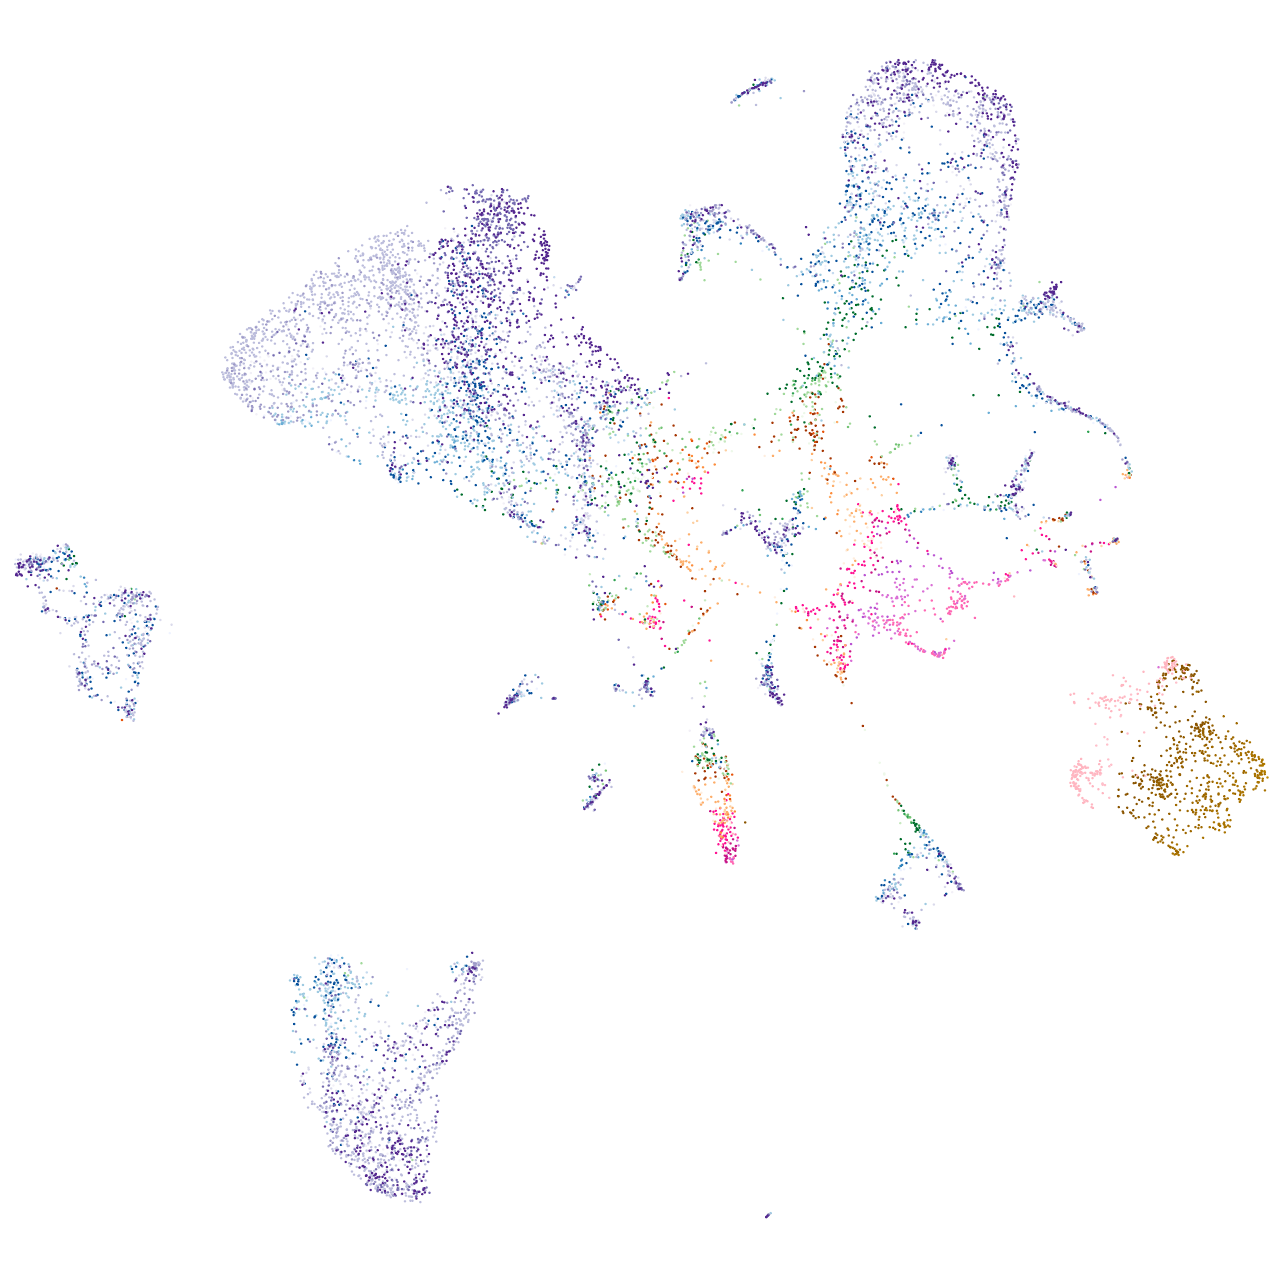
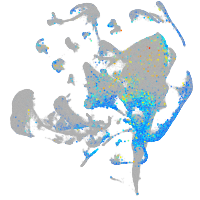
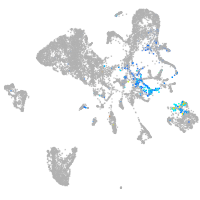
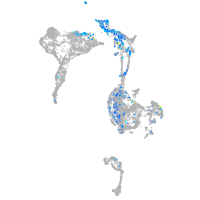
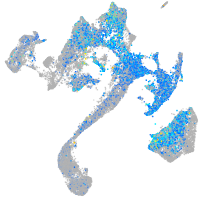
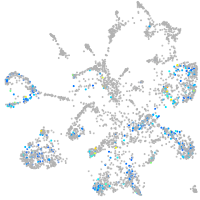
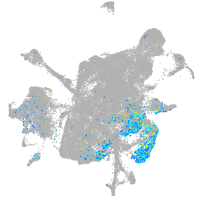
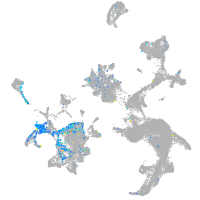
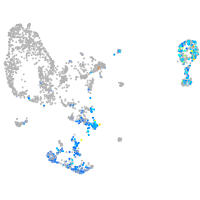
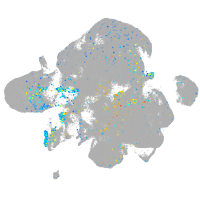
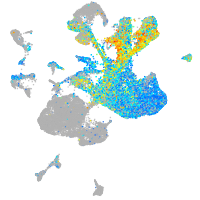
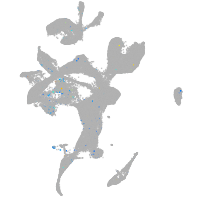
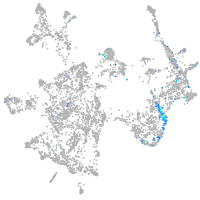
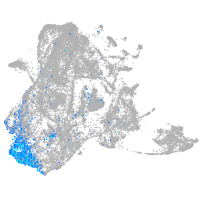
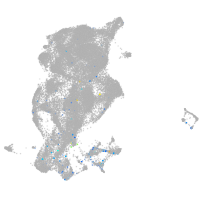
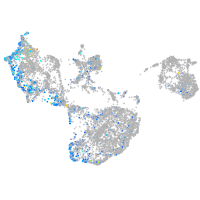
Gene expression UMAP


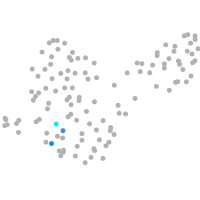


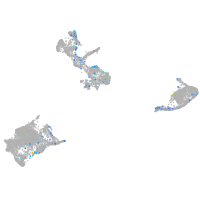
Expression by stage/cluster
Correlated gene expression
| Positive correlation | Negative correlation | ||
| Gene | r | Gene | r |
| hoxc8a | 0.511 | aldob | -0.189 |
| cdx4 | 0.437 | gapdh | -0.186 |
| hoxc6b | 0.411 | ahcy | -0.176 |
| hoxd9a | 0.404 | gamt | -0.170 |
| hoxb7a | 0.399 | sod1 | -0.165 |
| hoxc3a | 0.397 | eno3 | -0.162 |
| hoxa9b | 0.383 | eef1da | -0.155 |
| BX005254.3 | 0.369 | gatm | -0.151 |
| isl2a | 0.367 | nme2b.1 | -0.150 |
| hoxb10a | 0.360 | nupr1b | -0.146 |
| hapln1b | 0.354 | bhmt | -0.145 |
| apela | 0.350 | glud1b | -0.144 |
| znfl2a | 0.349 | fbp1b | -0.143 |
| fgf10b | 0.346 | atp5if1b | -0.139 |
| hoxa11b | 0.331 | gpx4a | -0.139 |
| hoxc9a | 0.317 | tpi1b | -0.139 |
| wnt2bb | 0.312 | mat1a | -0.138 |
| lypd6b | 0.305 | apoa1b | -0.138 |
| emid1 | 0.301 | apoa4b.1 | -0.134 |
| efna5a | 0.301 | mdh1aa | -0.133 |
| BX001014.2 | 0.300 | cx32.3 | -0.132 |
| ptgs1 | 0.300 | suclg1 | -0.132 |
| sall4 | 0.300 | apoc2 | -0.131 |
| hoxa10b | 0.295 | scp2a | -0.130 |
| hoxd11a | 0.284 | aldh6a1 | -0.130 |
| nradd | 0.282 | sod2 | -0.129 |
| wnt5b | 0.281 | dap | -0.129 |
| prickle1a | 0.279 | acadm | -0.128 |
| fstl1a | 0.278 | apoa2 | -0.128 |
| hoxa9a | 0.278 | abat | -0.128 |
| hoxd10a | 0.271 | gstp1 | -0.128 |
| oc90 | 0.271 | aqp12 | -0.127 |
| mllt3 | 0.269 | ckba | -0.125 |
| fgfrl1b | 0.268 | aldh7a1 | -0.124 |
| cx43.4 | 0.267 | rpl37 | -0.124 |