Daniocell
si:dkey-10o6.2 (taste / olfactory)
si:dkey-10o6.2
ZFIN
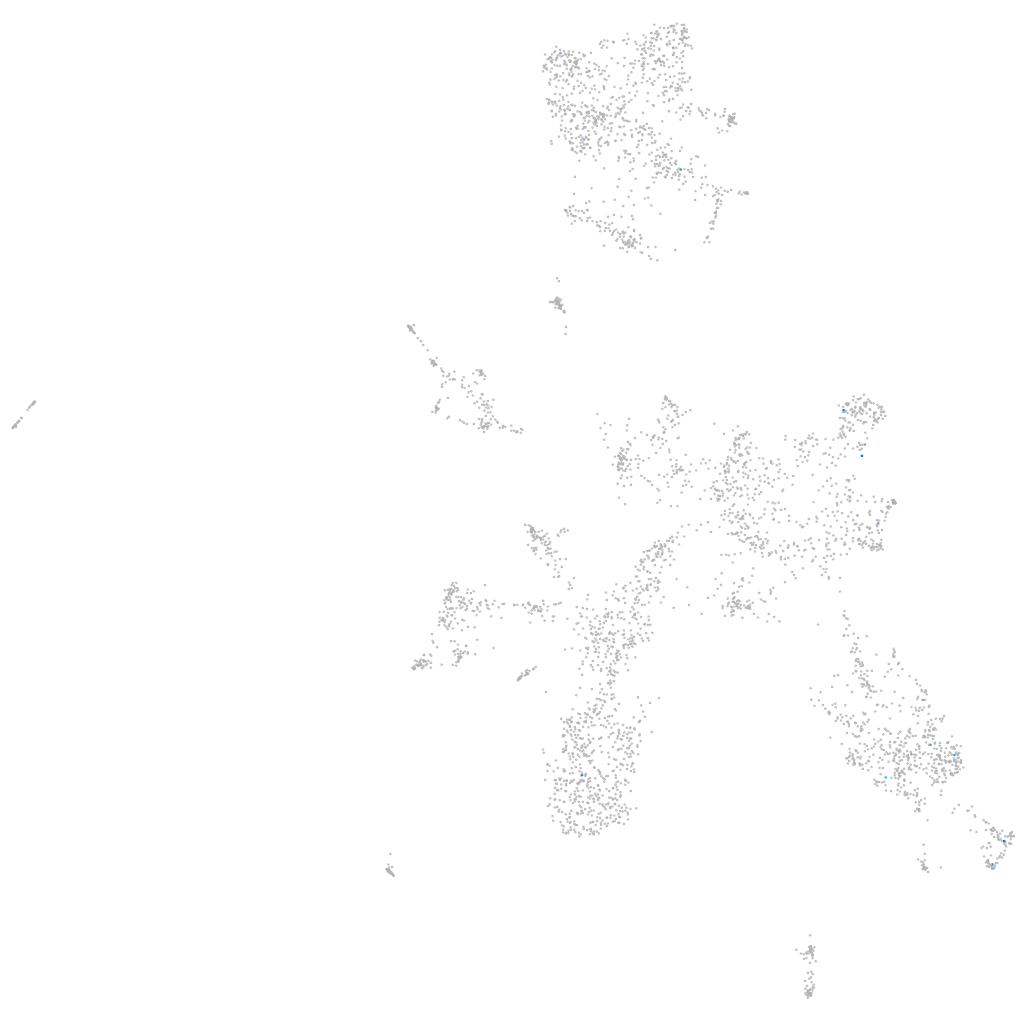
Gene expression UMAP
Display:
Expression
Stage
Other cell groups
all cells
blastomeres
PGCs
endoderm
axial mesoderm
muscle
mural cells /
non-skeletal muscle
mesenchyme
hematopoietic /
vasculature
pronephros
neural
spinal cord / glia
eye
taste / olfactory
otic / lateral line
epidermis
periderm
fin
ionocytes / mucous
pigment cells
Expression by stage/cluster
Correlated gene expression
Positive correlation
Negative correlation
Gene
r
Gene
r
hykk.1
0.299
hmgb1a
-0.041
AL929457.2
0.281
si:ch211-246m6.4
-0.032
btr22
0.278
CU467822.1
-0.032
LOC103911924
0.269
elavl4
-0.032
si:ch1073-80i24.3
0.267
myt1a
-0.031
CABZ01040054.1
0.241
atp6v0ca
-0.030
XLOC-043665
0.232
rab1ba
-0.030
CABZ01117840.1
0.228
atp6v0cb
-0.030
opn8b
0.212
kif5bb
-0.030
si:zfos-451d2.2
0.204
hnrnpul1l
-0.030
drl
0.204
jpt1b
-0.030
si:ch211-114l13.4
0.202
si:dkey-56m19.5
-0.029
znfl1g
0.198
aip
-0.029
megf6b
0.175
ss18
-0.029
LOC108191766
0.174
CR383676.1
-0.029
taar20c
0.174
nova2
-0.028
nrm
0.174
ptmaa
-0.028
BX927282.2
0.172
snrpc
-0.028
cx47.1
0.171
myt1b
-0.028
FQ976909.1
0.171
marcksl1b
-0.028
si:ch211-194h1.2
0.158
hbae1.1
-0.028
si:dkey-4c15.13
0.158
cfl1
-0.027
c1ql3b
0.155
sox11a
-0.027
v2rx3
0.155
ncam1a
-0.027
btg4
0.154
tp53inp2
-0.027
LOC100332293
0.150
tspan3a
-0.027
si:dkey-13n15.2
0.150
cxcr4b
-0.027
si:ch211-254p10.2
0.148
hbbe1.3
-0.027
BX248521.2
0.148
ebf3a
-0.026
SLC46A3 (1 of many)
0.145
trappc3
-0.026
CABZ01067980.1
0.143
cd99l2
-0.026
si:dkeyp-90h9.1
0.142
grinab
-0.026
fjx1
0.142
celf3a
-0.026
stpg2
0.138
srpra
-0.026
znf1051
0.136
sox11b
-0.026