Daniocell
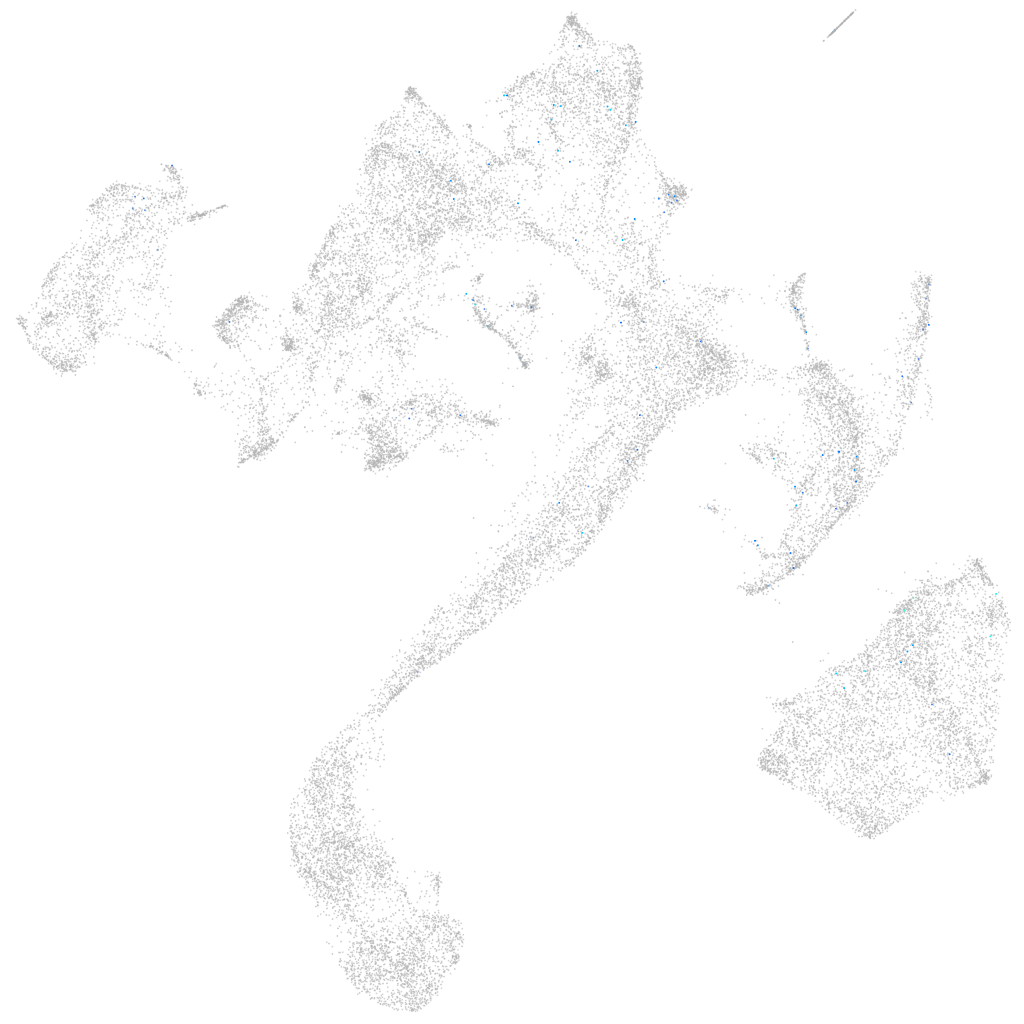
si:dkey-10o6.2 (muscle)
si:dkey-10o6.2
ZFIN
Gene expression UMAP
Display:
Expression
Stage
Other cell groups
all cells
blastomeres
PGCs
endoderm
axial mesoderm
muscle
mural cells /
non-skeletal muscle
mesenchyme
hematopoietic /
vasculature
pronephros
neural
spinal cord / glia
eye
taste / olfactory
otic / lateral line
epidermis
periderm
fin
ionocytes / mucous
pigment cells
Expression by stage/cluster
Correlated gene expression
Positive correlation
Negative correlation
Gene
r
Gene
r
tas2r200.2
0.178
ckma
-0.028
LOC101885008
0.139
atp2a1
-0.027
CABZ01072532.1
0.129
tnnt3a
-0.027
cidec
0.129
ckmb
-0.027
LOC110439488
0.122
si:ch73-367p23.2
-0.026
CR589875.1
0.121
pabpc4
-0.025
si:dkey-203a12.4
0.110
tnnt3b
-0.025
CU694317.1
0.097
nme2b.2
-0.025
CU571169.1
0.089
cfl2
-0.025
CR394528.1
0.089
prx
-0.025
FP103048.1
0.087
actc1b
-0.025
si:dkey-246g23.4
0.087
si:dkey-16p21.8
-0.025
si:rp71-77l1.2
0.082
minos1
-0.024
dao.1
0.078
hrc
-0.024
hrh2b
0.077
myl1
-0.024
LOC110439807
0.076
glud1b
-0.024
XLOC-036963
0.076
ryr1b
-0.024
XLOC-042938
0.075
pvalb2
-0.023
RF00276
0.073
pgam2
-0.023
LOC103910018
0.070
pvalb1
-0.023
LOC110437800
0.070
tnni2a.4
-0.023
si:dkey-13n15.2
0.069
hhatla
-0.023
cxcl8b.1
0.068
tmem38a
-0.023
CR626882.2
0.066
mylpfa
-0.023
XLOC-000357
0.065
casq1b
-0.023
LOC108183612
0.063
nmrk2
-0.023
taar19k
0.063
pgk1
-0.023
si:ch73-337l15.2
0.063
ndufb5
-0.023
mir459
0.062
ttn.2
-0.023
gcga
0.061
eef2l2
-0.023
tiam2b
0.061
ak1
-0.023
BX005085.7
0.060
aldoab
-0.023
tmprss3b
0.058
ank1a
-0.022
buc
0.057
actn3a
-0.022
CABZ01101739.1
0.057
gapdh
-0.022