Daniocell
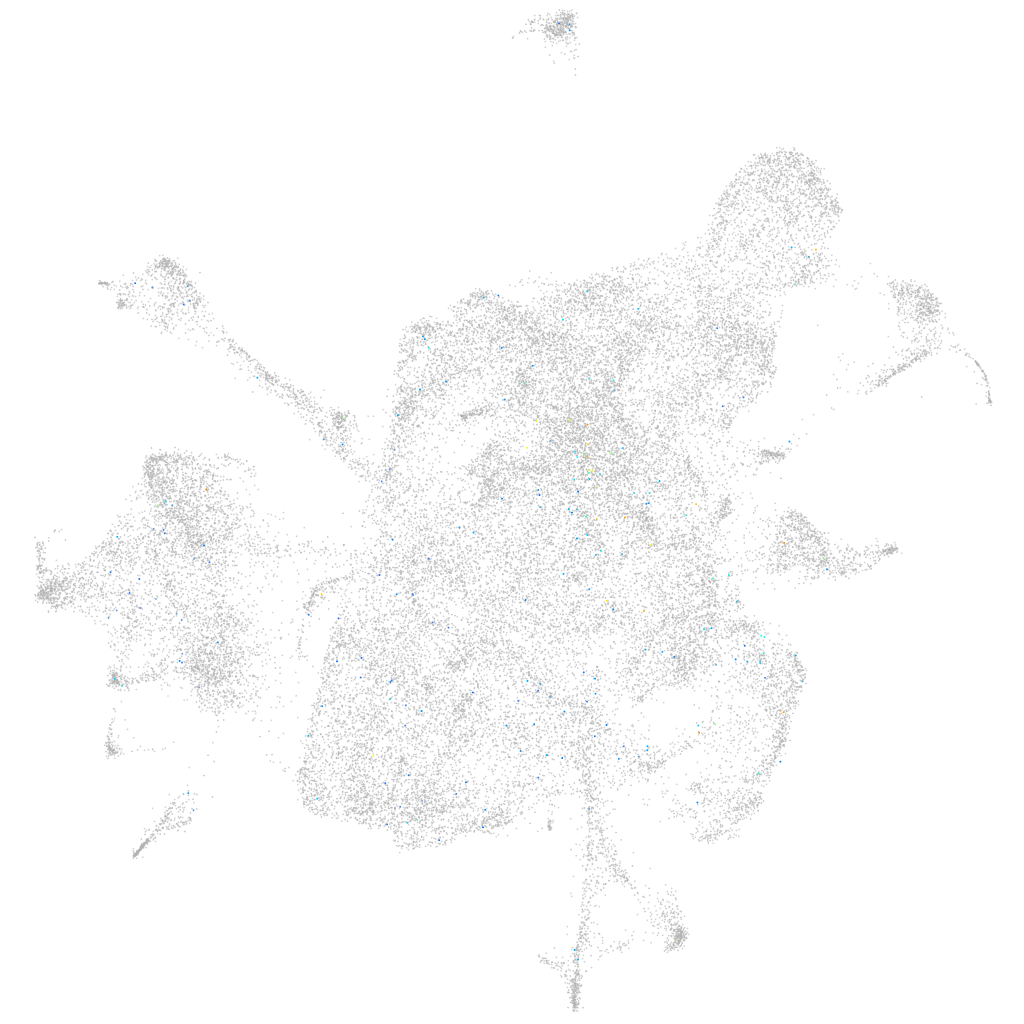
si:dkey-10o6.2 (mesenchyme)
si:dkey-10o6.2
ZFIN
Gene expression UMAP
Display:
Expression
Stage
Other cell groups
all cells
blastomeres
PGCs
endoderm
axial mesoderm
muscle
mural cells /
non-skeletal muscle
mesenchyme
hematopoietic /
vasculature
pronephros
neural
spinal cord / glia
eye
taste / olfactory
otic / lateral line
epidermis
periderm
fin
ionocytes / mucous
pigment cells
Expression by stage/cluster
Correlated gene expression
Positive correlation
Negative correlation
Gene
r
Gene
r
f13a1a.1
0.137
col2a1a
-0.023
si:ch211-272h9.3
0.085
col9a2
-0.021
AL831726.3
0.082
col9a1a
-0.020
LOC110439590
0.078
fgfbp2b
-0.020
LOC108179225
0.074
col9a3
-0.017
csf3r
0.069
sox9a
-0.017
CABZ01061501.1
0.069
mrpl35
-0.016
zgc:153921
0.065
matn4
-0.016
LOC101882015
0.063
col11a2
-0.015
si:ch211-212k18.15
0.062
cthrc1a
-0.015
FP016005.1
0.062
aimp1
-0.015
tbx21
0.057
ext1c
-0.014
CR384099.1
0.057
matn1
-0.014
LO018260.2
0.056
zgc:66388
-0.014
LOC110439364
0.056
hmgb1a
-0.013
BX005329.2
0.055
cnmd
-0.013
cngb3.1
0.055
AL929222.2
-0.013
myh7l
0.054
si:ch211-11k18.4
-0.013
xpnpep2
0.053
uqcrc2b
-0.013
pigrl2.3
0.053
wfdc2
-0.013
LOC108191706
0.052
SCARF2
-0.013
si:dkeyp-46h3.6
0.051
tram1
-0.012
LOC101884314
0.050
slc35d1a
-0.012
XLOC-044226
0.050
ndufa1
-0.012
BX276088.1
0.049
CYTL1
-0.012
BX005256.1
0.048
clta
-0.012
dlk2
0.047
trabd2a
-0.012
CABZ01068356.1
0.046
ppa1b
-0.012
zgc:195173
0.046
klf2b
-0.012
XLOC-037028
0.046
emilin1a
-0.012
XLOC-005048
0.045
tnmd
-0.011
lft2
0.045
otos
-0.011
nt5dc3
0.045
dedd
-0.011
spink2.4
0.043
sucla2
-0.011
XLOC-025546
0.042
XLOC-043857
-0.011