Daniocell
si:dkey-10o6.2 (mural cells / non-skeletal muscle)
si:dkey-10o6.2
ZFIN
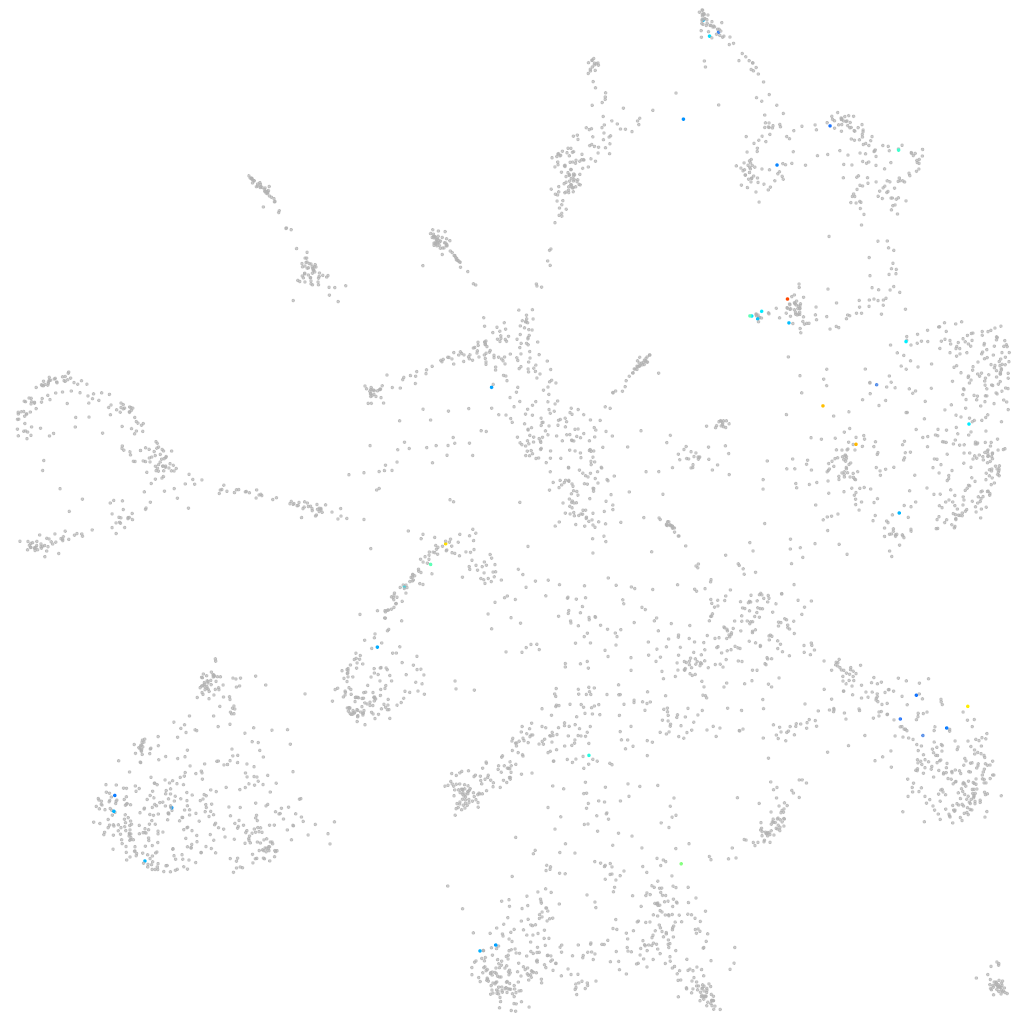
Gene expression UMAP
Display:
Expression
Stage
Other cell groups
all cells
blastomeres
PGCs
endoderm
axial mesoderm
muscle
mural cells /
non-skeletal muscle
mesenchyme
hematopoietic /
vasculature
pronephros
neural
spinal cord / glia
eye
taste / olfactory
otic / lateral line
epidermis
periderm
fin
ionocytes / mucous
pigment cells
Expression by stage/cluster
Correlated gene expression
Positive correlation
Negative correlation
Gene
r
Gene
r
LOC110437705
0.342
rpl13a
-0.052
sb:cb1058
0.255
rpsa
-0.052
XLOC-024493
0.233
faua
-0.047
XLOC-043568
0.223
fkbp1aa
-0.047
adgrl1.1
0.217
foxp4
-0.047
XLOC-034488
0.216
rpl7a
-0.045
lrata
0.206
rps9
-0.043
hcrt
0.194
rpl19
-0.043
rdh20
0.194
myl6
-0.041
LOC101885764
0.194
rpl18a
-0.041
sfmbt2
0.187
rpl10a
-0.041
si:ch211-210b2.2
0.184
rps3a
-0.040
cyp3c4
0.183
nme2b.1
-0.040
znf1032
0.181
sf3a2
-0.039
XLOC-004437
0.179
atf4a
-0.039
si:dkeyp-90h9.1
0.176
rpl36
-0.039
si:ch211-207d6.2
0.176
myl9a
-0.039
brinp3b
0.175
acta2
-0.038
CR933734.2
0.173
ppiab
-0.038
XLOC-037785
0.173
eif4e2rs1
-0.037
CABZ01034851.1
0.172
ntn5
-0.037
XLOC-032715
0.172
fam133b
-0.037
CABZ01113369.1
0.169
rps27.1
-0.037
LOC103909899
0.169
aip
-0.037
prr15lb
0.167
pinx1
-0.036
LOC108181518
0.166
serbp1a
-0.036
XLOC-005257
0.166
cox6b2
-0.036
si:ch211-214k5.3
0.165
rps20
-0.035
zgc:194336
0.162
rpl13
-0.035
gdf2
0.161
rpl32
-0.035
urad
0.160
rpl10
-0.035
si:ch211-270n8.1
0.158
rps27.2
-0.035
ehd4
0.158
rps12
-0.035
ptger2a
0.154
hsp90ab1
-0.035
AL954142.3
0.152
ubxn1
-0.034