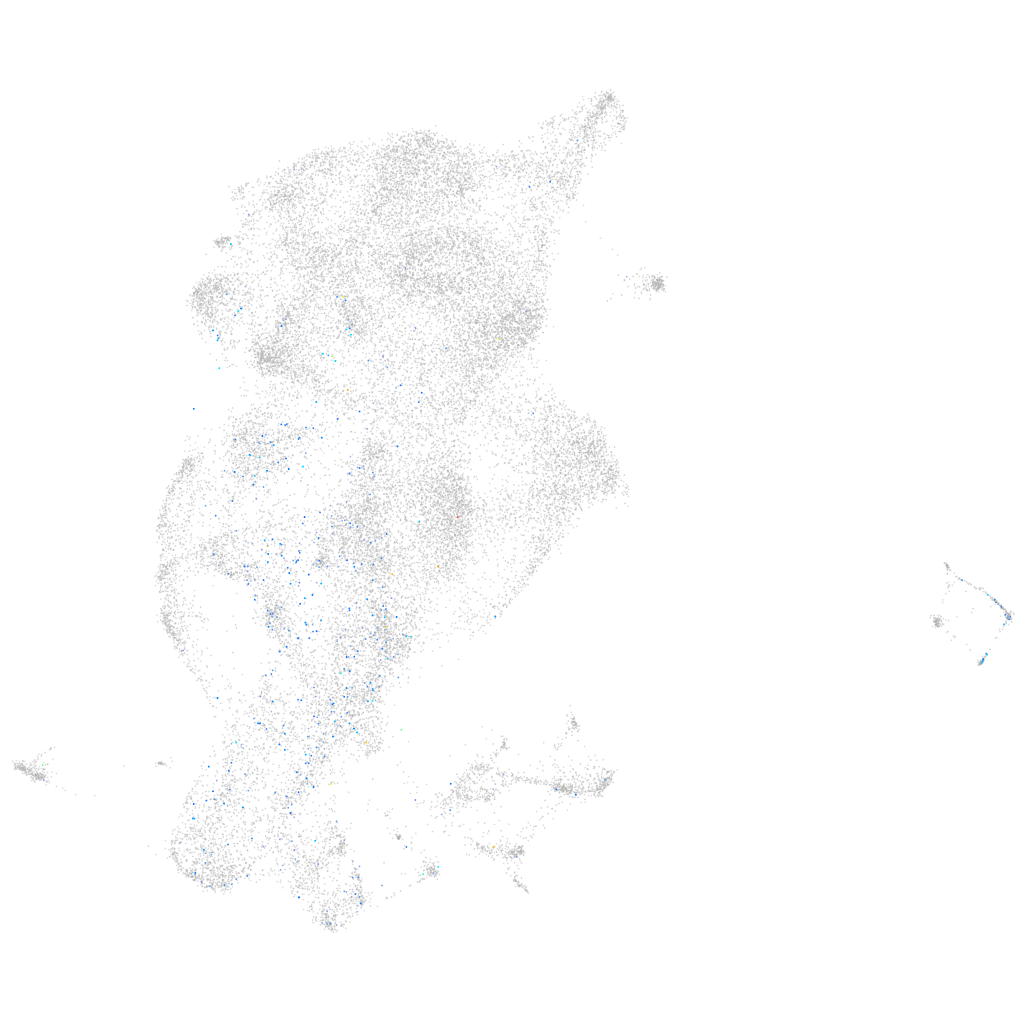
Daniocell
si:dkey-10o6.2 (periderm)
si:dkey-10o6.2
ZFIN
Gene expression UMAP
Display:
Expression
Stage
Other cell groups
all cells
blastomeres
PGCs
endoderm
axial mesoderm
muscle
mural cells /
non-skeletal muscle
mesenchyme
hematopoietic /
vasculature
pronephros
neural
spinal cord / glia
eye
taste / olfactory
otic / lateral line
epidermis
periderm
fin
ionocytes / mucous
pigment cells
Expression by stage/cluster
Correlated gene expression
Positive correlation
Negative correlation
Gene
r
Gene
r
BX005392.1
0.122
si:ch211-207n23.2
-0.086
zdhhc11
0.098
rplp1
-0.068
LOC110437970
0.096
wu:fa03e10
-0.067
si:ch211-196f5.9
0.094
nme2b.1
-0.066
tmsb4x
0.094
rpl36a
-0.066
BX629346.2
0.091
rpl37
-0.064
thbs1b
0.090
si:dkeyp-51b9.3
-0.063
emp3b
0.089
rpl26
-0.061
scamp5b
0.088
rps10
-0.061
BX601648.1
0.087
si:dkey-248g15.3
-0.060
zgc:194839
0.086
krt17
-0.059
gpr183a
0.085
si:dkey-247k7.2
-0.057
si:ch73-226l13.2
0.084
rplp0
-0.056
ttc12
0.084
rps25
-0.056
TSTA3
0.083
rpl28
-0.056
acer1
0.083
rps23
-0.055
BX511111.1
0.083
rhcgl1
-0.055
sema3bl
0.082
rps27a
-0.055
CR377211.1
0.081
rpl7
-0.054
slc38a8b
0.080
scel
-0.054
dnase1l4.1
0.079
rps21
-0.054
naprt
0.079
eef1da
-0.053
ANXA1
0.079
eef1b2
-0.053
CABZ01073197.1
0.076
rpl39
-0.051
hoxb5a
0.075
rpl27
-0.051
hmga1a
0.075
rps2
-0.050
nos1
0.074
si:dkey-151g10.6
-0.049
si:ch211-210g13.5
0.073
rpl23
-0.049
alox5b.3
0.073
eevs
-0.049
ltb4r2a
0.073
rplp2l
-0.049
cdh1
0.073
rps29
-0.049
best1
0.071
si:dkey-33c14.3
-0.049
LOC100001846
0.071
ddx21
-0.048
si:ch73-347e22.8
0.071
rps14
-0.048
cadm1a
0.071
rps17
-0.048