Daniocell
si:dkey-10o6.2 (fin)
si:dkey-10o6.2
ZFIN
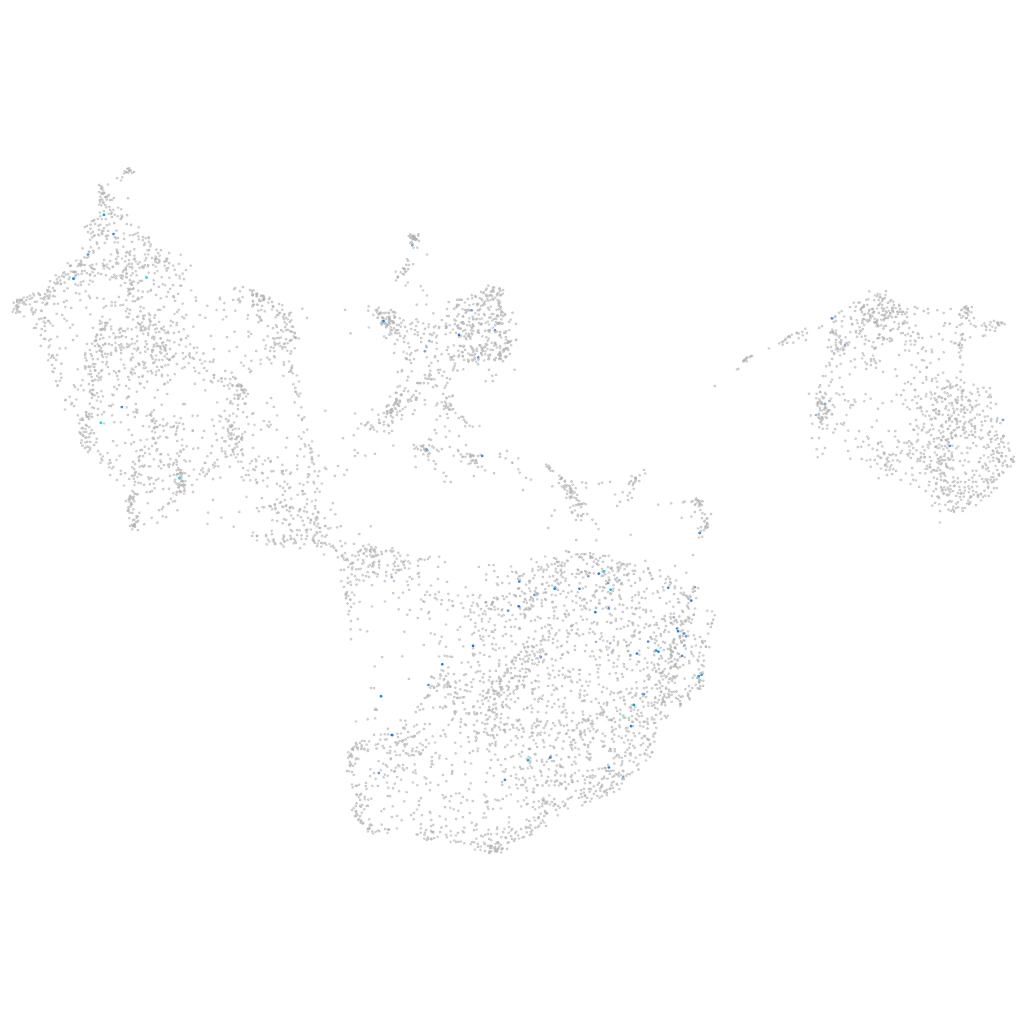
Gene expression UMAP
Display:
Expression
Stage
Other cell groups
all cells
blastomeres
PGCs
endoderm
axial mesoderm
muscle
mural cells /
non-skeletal muscle
mesenchyme
hematopoietic /
vasculature
pronephros
neural
spinal cord / glia
eye
taste / olfactory
otic / lateral line
epidermis
periderm
fin
ionocytes / mucous
pigment cells
Expression by stage/cluster
Correlated gene expression
Positive correlation
Negative correlation
Gene
r
Gene
r
LOC110438502
0.272
im:7150988
-0.042
LOC100536487
0.256
CABZ01074130.1
-0.035
LOC100003040
0.250
anxa1c
-0.033
CU459094.3
0.217
angptl7
-0.031
mir92a-2
0.211
marcksl1a
-0.031
BX510992.2
0.206
si:dkey-222n6.2
-0.030
RF00608
0.204
LOC100538221
-0.030
LOC101886519
0.196
selenow2b
-0.029
si:ch211-203k16.3
0.181
ephb3
-0.029
zgc:56231
0.163
hoxc13a
-0.028
LOC108190067
0.161
thbs4b
-0.028
crygm2d21
0.153
lye
-0.028
LOC108182237
0.140
si:ch73-52f15.5
-0.028
LOC110439944
0.136
si:ch211-207n23.2
-0.028
pimr209
0.135
cldne
-0.028
zgc:171601
0.129
enc1
-0.028
LOC110439601
0.125
ptprga
-0.028
CU929054.1
0.123
zc3h11a
-0.028
LOC110439242
0.122
evpla
-0.027
si:ch211-155m12.5
0.120
stx11b.1
-0.027
si:ch73-252i11.1
0.116
mgst1.2
-0.027
CT573103.1
0.114
ppil1
-0.027
zfyve9b
0.113
scel
-0.027
XLOC-037523
0.109
twist1a
-0.027
snx18b
0.104
si:dkey-87o1.2
-0.027
zgc:112966
0.103
uap1
-0.027
fndc7a
0.099
agr1
-0.027
AL928908.2
0.097
icn2
-0.026
si:ch211-254c8.3
0.097
abcb5
-0.026
cxcr3.2
0.096
zgc:111983
-0.026
CABZ01080371.3
0.095
ddx39ab
-0.026
si:dkey-190j3.6
0.095
LOC100535130
-0.026
tigarb
0.093
si:ch211-195b11.3
-0.026
psme4a
0.093
krt96
-0.026
si:ch211-213d14.2
0.093
rhoab
-0.026