Daniocell
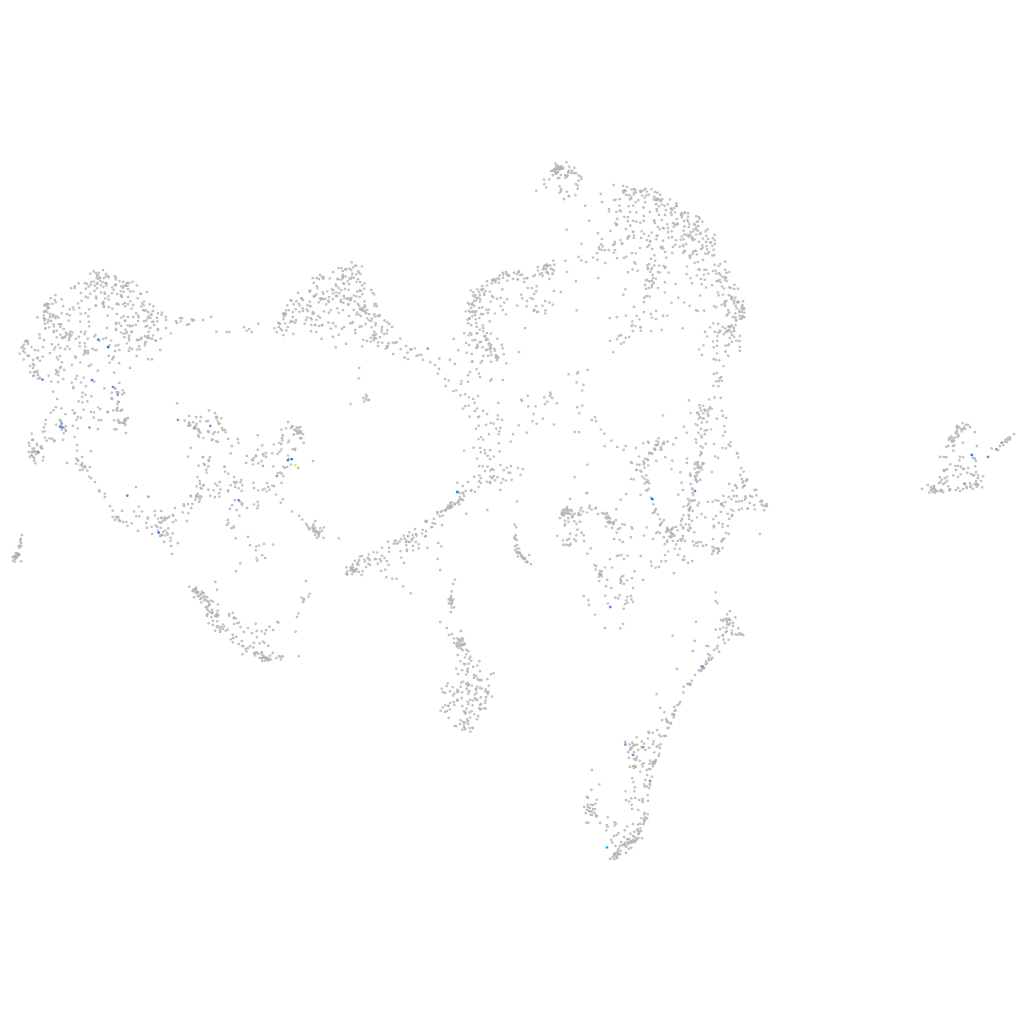
si:dkey-10o6.2 (ionocytes / mucous-producing)
si:dkey-10o6.2
ZFIN
Gene expression UMAP
Display:
Expression
Stage
Other cell groups
all cells
blastomeres
PGCs
endoderm
axial mesoderm
muscle
mural cells /
non-skeletal muscle
mesenchyme
hematopoietic /
vasculature
pronephros
neural
spinal cord / glia
eye
taste / olfactory
otic / lateral line
epidermis
periderm
fin
ionocytes / mucous
pigment cells
Expression by stage/cluster
Correlated gene expression
Positive correlation
Negative correlation
Gene
r
Gene
r
skor1b
0.397
cldnh
-0.069
si:ch211-279g13.1
0.341
nipal4
-0.039
LOC100537082
0.311
hbae1.1
-0.037
znf1182
0.295
ndufa2
-0.037
LOC101884850
0.261
pbxip1b
-0.036
LOC101886390
0.246
fabp3
-0.036
si:dkey-202b22.6
0.237
lrpprc
-0.035
CABZ01081294.1
0.220
atp5pb
-0.035
LOC110438353
0.215
malb
-0.035
znf1136
0.206
NC-002333.4
-0.035
LO018383.1
0.189
tmed7
-0.034
tcf4
0.186
ndufa3
-0.034
armh1
0.186
actc1b
-0.034
zgc:65851
0.184
si:dkey-87o1.2
-0.033
CR759845.2
0.184
ppargc1b
-0.033
rps6ka1
0.183
kita
-0.033
spag1b
0.181
cox7a2l
-0.033
wdr54
0.172
hmgn3
-0.032
CR548634.2
0.172
ndufa6
-0.032
enpp1
0.167
atp5meb
-0.032
si:dkey-246g23.4
0.167
tspan35
-0.032
znf1137
0.166
mccc2
-0.032
ift172
0.166
uqcrq
-0.032
elnb
0.162
foxi3b
-0.032
si:dkey-235d18.5
0.160
coa7
-0.032
cryba4
0.157
cycsb
-0.032
cacna1ab
0.157
rgs2
-0.031
iqcb1
0.157
tmbim4
-0.031
rdh10a
0.155
tmed4
-0.031
ky
0.151
wdr83os
-0.031
LOC103909923
0.146
hbbe1.3
-0.031
foxl2b
0.145
tent5bb
-0.031
LOC108181101
0.145
mt-nd4
-0.030
npnt
0.144
ndufb9
-0.030
si:ch211-191i18.2
0.143
capn8
-0.030