Daniocell
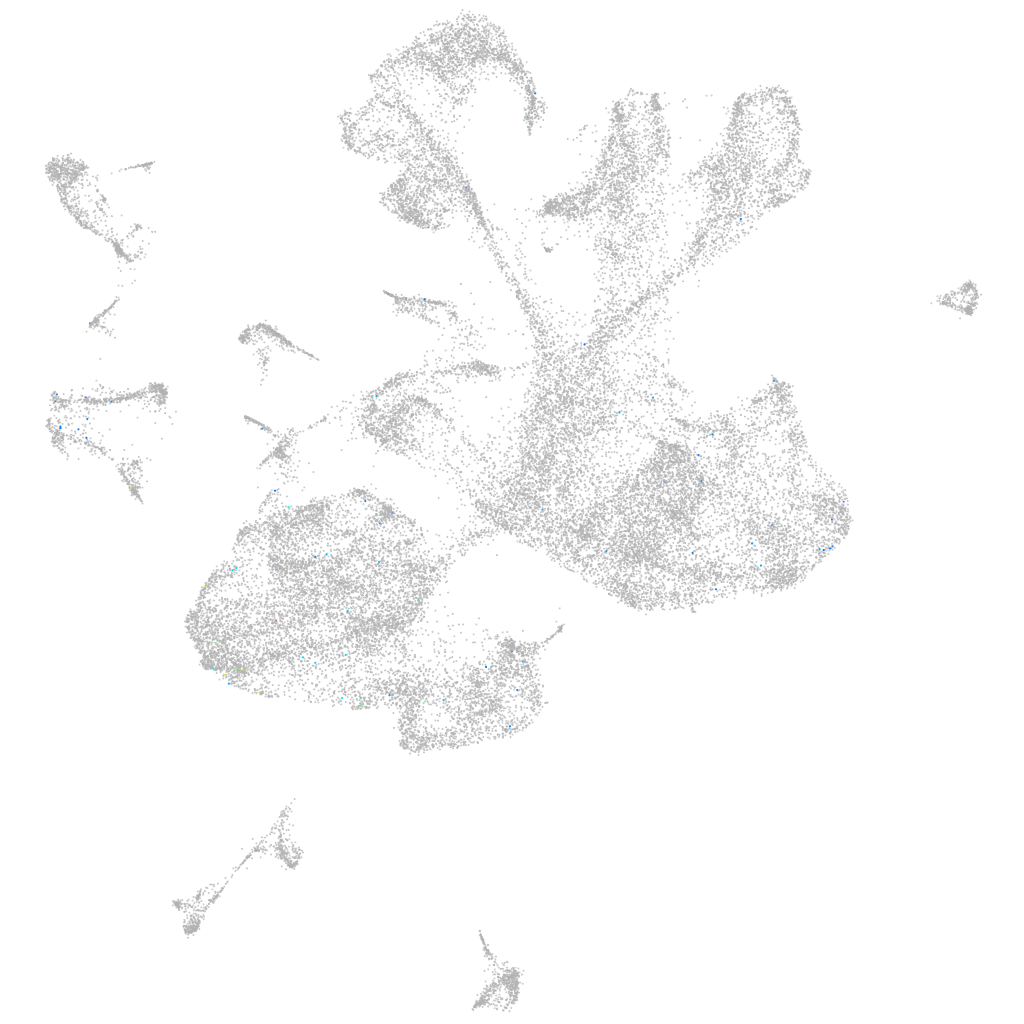
si:dkey-10o6.2 (glial cells / spinal cord)
si:dkey-10o6.2
ZFIN
Gene expression UMAP
Display:
Expression
Stage
Other cell groups
all cells
blastomeres
PGCs
endoderm
axial mesoderm
muscle
mural cells /
non-skeletal muscle
mesenchyme
hematopoietic /
vasculature
pronephros
neural
spinal cord / glia
eye
taste / olfactory
otic / lateral line
epidermis
periderm
fin
ionocytes / mucous
pigment cells
Expression by stage/cluster
Correlated gene expression
Positive correlation
Negative correlation
Gene
r
Gene
r
CU570782.2
0.143
myt1b
-0.022
pimr130
0.117
ptmaa
-0.021
LOC100536629
0.114
ptmab
-0.021
si:dkey-38n4.2
0.103
stmn1b
-0.019
BX927401.1
0.103
myt1a
-0.019
CABZ01049825.1
0.091
si:ch211-222l21.1
-0.018
or106-10
0.089
tmsb
-0.018
CT030031.1
0.079
elavl3
-0.018
XLOC-012207
0.078
golga7ba
-0.017
p2ry13
0.078
sncb
-0.016
XLOC-013671
0.074
hoxb9a
-0.016
macrod1
0.072
calm2b
-0.016
LOC100536676
0.068
cirbpb
-0.016
LOC103911324
0.068
hmgb1a
-0.016
BX649516.3
0.068
stxbp1a
-0.016
si:ch211-217a12.1
0.066
si:dkeyp-75h12.5
-0.016
LOC110437749
0.062
epb41a
-0.016
arsk
0.058
gng3
-0.016
si:dkey-241l7.6
0.054
si:dkey-276j7.1
-0.016
c3a.3
0.054
hoxa9b
-0.015
XLOC-019859
0.052
zc4h2
-0.015
LOC101882729
0.052
mlf2
-0.015
BX649423.2
0.051
rtn1b
-0.015
kcnj12a
0.051
elavl4
-0.015
mfrp
0.051
rab1bb
-0.015
LOC108190497
0.049
ssbp3b
-0.015
zgc:92481
0.049
hmgb3a
-0.014
cyp27a1.2
0.047
pbx1a
-0.014
lgals9l1
0.046
scrt2
-0.014
XLOC-002557
0.046
h3f3d
-0.014
LOC108179813
0.045
atcaya
-0.014
BX088603.1
0.045
atp1b2a
-0.014
AL954695.2
0.045
fus
-0.014
XLOC-030940
0.045
hoxb8a
-0.014
AL928977.1
0.045
vamp2
-0.014