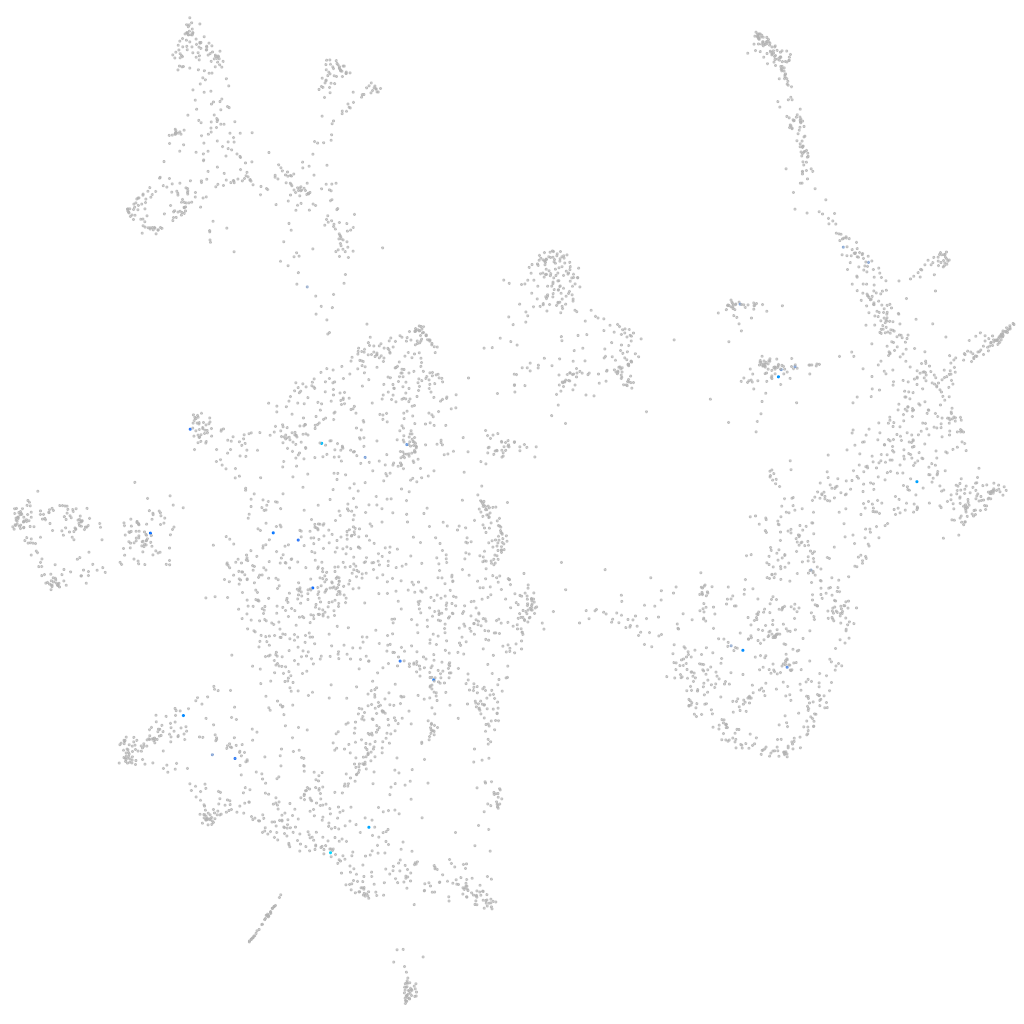
Daniocell
si:dkey-10o6.2 (otic / lateral line)
si:dkey-10o6.2
ZFIN
Gene expression UMAP
Display:
Expression
Stage
Other cell groups
all cells
blastomeres
PGCs
endoderm
axial mesoderm
muscle
mural cells /
non-skeletal muscle
mesenchyme
hematopoietic /
vasculature
pronephros
neural
spinal cord / glia
eye
taste / olfactory
otic / lateral line
epidermis
periderm
fin
ionocytes / mucous
pigment cells
Expression by stage/cluster
Correlated gene expression
Positive correlation
Negative correlation
Gene
r
Gene
r
si:ch211-160d20.5
0.312
sdhc
-0.033
LOC103909072
0.310
actc1b
-0.032
si:ch211-274f20.2
0.275
ndufs7
-0.031
CR394545.1
0.268
pgk1
-0.031
CABZ01072487.2
0.267
smim20
-0.030
CABZ01038493.1
0.245
atp5pf
-0.030
BX004785.1
0.241
ndufa5
-0.029
XLOC-020303
0.231
hexim1
-0.029
jak3
0.220
calm1b
-0.029
BX927394.2
0.209
tardbpl
-0.028
XLOC-043310
0.200
ap1b1
-0.028
XLOC-026920
0.195
COX3
-0.028
LOC108191766
0.193
stx12
-0.028
mmp20a
0.192
hbae1.1
-0.028
aadat
0.192
wdfy1
-0.027
XLOC-035844
0.183
si:dkey-78l4.14
-0.027
LOC100004848
0.173
pdhb
-0.027
pcdh1gb9
0.167
zgc:158463
-0.027
zgc:158432
0.165
nr2f6b
-0.026
BX548024.2
0.164
hbae1.3
-0.026
znf1070
0.162
atp6v0cb
-0.026
CT990567.2
0.153
cs
-0.026
efemp1
0.145
cops9
-0.026
si:ch73-158p21.3
0.135
si:dkey-17m8.1
-0.026
LOC100536116
0.130
ckbb
-0.026
XLOC-000324
0.126
mt-co2
-0.025
trim110
0.125
kdm5ba
-0.025
gig2p
0.123
nipblb
-0.025
XLOC-042165
0.123
tpm2
-0.025
tdp2a
0.122
apoa2
-0.025
asz1
0.122
si:ch211-235e9.6
-0.025
gdf5
0.118
cox7c
-0.025
LOC103911255
0.116
atp1a3b
-0.025
zgc:153896
0.113
myl1
-0.024
LOC100332582
0.113
idh3b
-0.024