Daniocell
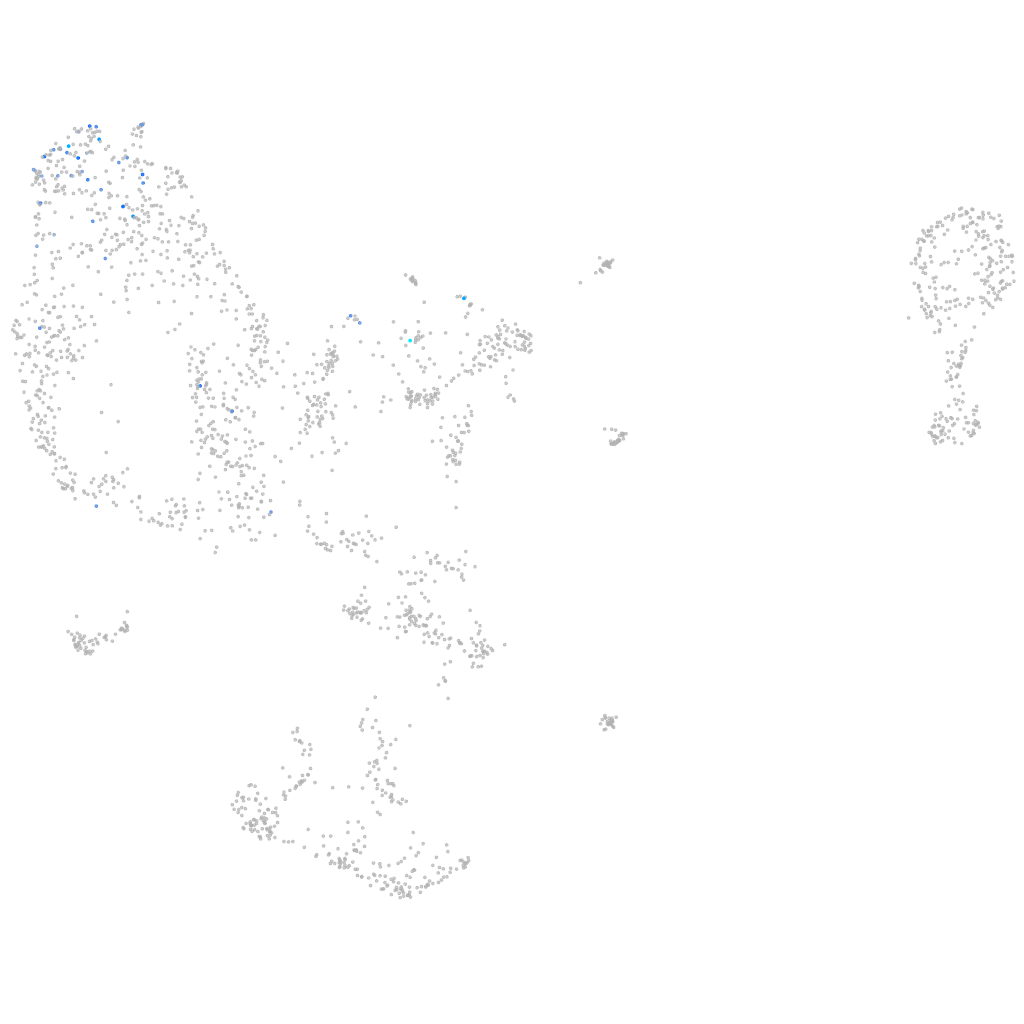
si:dkey-10o6.2 (pronephros)
si:dkey-10o6.2
ZFIN
Gene expression UMAP
Display:
Expression
Stage
Other cell groups
all cells
blastomeres
PGCs
endoderm
axial mesoderm
muscle
mural cells /
non-skeletal muscle
mesenchyme
hematopoietic /
vasculature
pronephros
neural
spinal cord / glia
eye
taste / olfactory
otic / lateral line
epidermis
periderm
fin
ionocytes / mucous
pigment cells
Expression by stage/cluster
Correlated gene expression
Positive correlation
Negative correlation
Gene
r
Gene
r
sim2.1
0.410
si:ch211-222l21.1
-0.112
mslna
0.406
hmga1a
-0.103
angptl1b
0.396
hmgn2
-0.103
slc5a8
0.374
hmgb2a
-0.099
tmprss13a
0.348
hmgn7
-0.096
agrp
0.337
hmgn6
-0.095
fbln5
0.335
ubc
-0.092
LOC110439013
0.326
h2afvb
-0.092
AL929048.1
0.310
h3f3d
-0.090
adm2b
0.293
hmgb2b
-0.089
coro2bb
0.293
cirbpb
-0.089
LOC110440131
0.293
nucks1a
-0.086
pi15a
0.281
si:ch73-281n10.2
-0.084
si:ch211-244b2.4
0.278
khdrbs1a
-0.083
loxa
0.269
si:dkey-56m19.5
-0.082
LOC103909697
0.265
cirbpa
-0.079
syt1b
0.265
ddx39ab
-0.079
AL928650.1
0.263
snrpf
-0.078
si:dkey-29m1.2
0.258
si:ch211-288g17.3
-0.078
ptchd4
0.255
ptmab
-0.076
card14
0.253
si:ch73-1a9.3
-0.076
si:ch211-136a13.1
0.253
snrpe
-0.075
zgc:153157
0.250
hdac1
-0.073
zgc:175280
0.249
hnrnpa0b
-0.073
glis1b
0.242
anp32b
-0.072
ecm2
0.239
marcksb
-0.072
c1qtnf12
0.237
hnrnpaba
-0.072
CABZ01039096.1
0.236
ilf2
-0.071
BX942813.1
0.233
hnrnpabb
-0.070
zgc:174904
0.231
eif2s2
-0.069
LOC108191316
0.230
tubb2b
-0.069
cyp2ad2
0.227
acin1a
-0.069
FP102018.1
0.226
meig1
-0.069
si:dkey-11o1.6
0.225
ube2ib
-0.068
slc5a2
0.223
sumo3a
-0.067