Daniocell
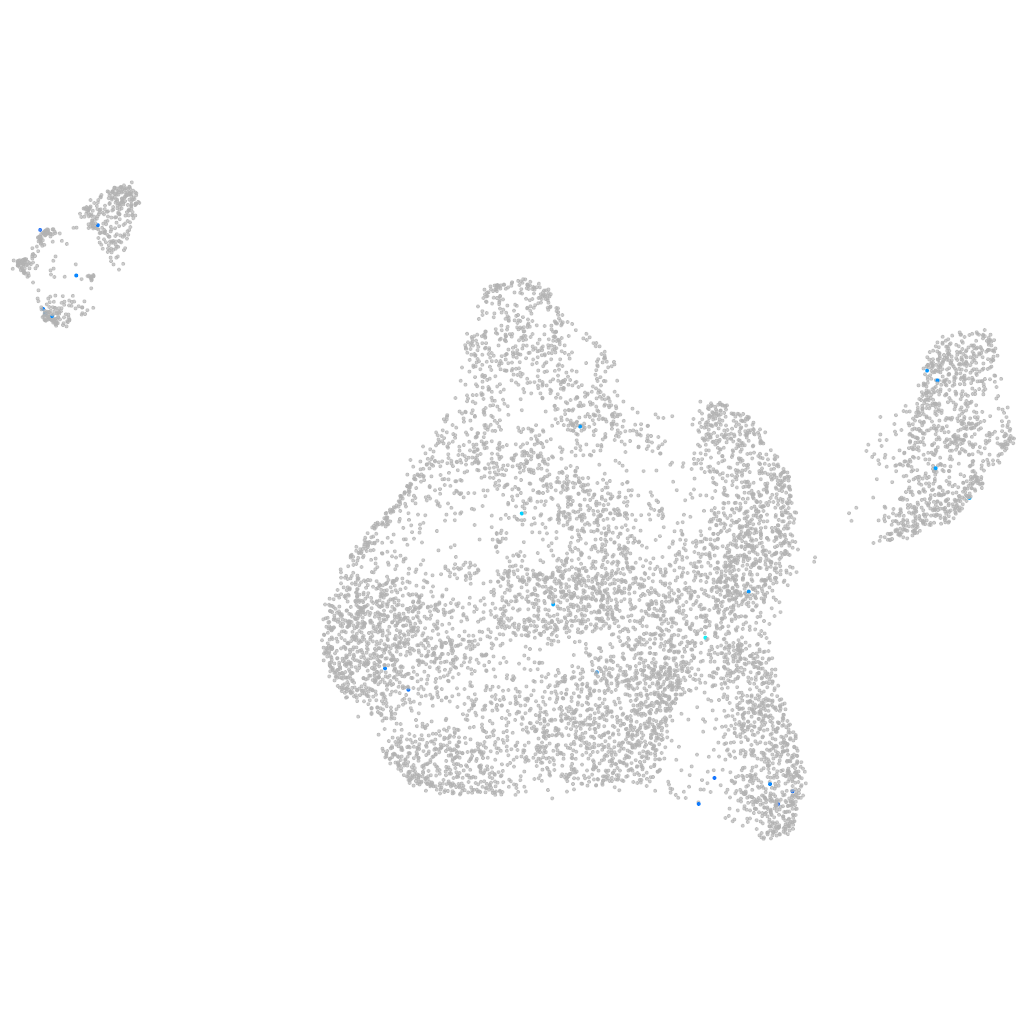
si:dkey-10o6.2 (blastomeres)
si:dkey-10o6.2
ZFIN
Gene expression UMAP
Display:
Expression
Stage
Other cell groups
all cells
blastomeres
PGCs
endoderm
axial mesoderm
muscle
mural cells /
non-skeletal muscle
mesenchyme
hematopoietic /
vasculature
pronephros
neural
spinal cord / glia
eye
taste / olfactory
otic / lateral line
epidermis
periderm
fin
ionocytes / mucous
pigment cells
Expression by stage/cluster
Correlated gene expression
Positive correlation
Negative correlation
Gene
r
Gene
r
XLOC-025821
0.352
akap8l
-0.036
CU929418.2
0.267
hspb1
-0.036
gpm6ba
0.243
rps15
-0.035
wu:fc38h03
0.241
rps16
-0.034
gabrr2b
0.212
khdrbs1a
-0.032
asphd1
0.207
rps12
-0.032
cd44b
0.193
marcksl1b
-0.032
LOC110438241
0.192
ewsr1a
-0.031
si:ch1073-75f15.2
0.189
rpl26
-0.031
XLOC-044202
0.189
rpl36
-0.031
dcc
0.188
hspe1
-0.029
LOC100535550
0.188
fam50a
-0.029
CABZ01059406.1
0.183
anp32b
-0.028
admb
0.182
hnrnpa0a
-0.028
CR855328.1
0.172
rps25
-0.028
aqp10b
0.157
si:ch73-281n10.2
-0.028
foxf1
0.157
rrp15
-0.028
BX248238.1
0.155
cirbpb
-0.028
LOC101882159
0.154
tp53inp2
-0.026
CU469362.1
0.152
si:ch1073-80i24.3
-0.026
LOC101884200
0.152
rps5
-0.025
tmem265
0.152
rps23
-0.025
LOC103909422
0.146
lrwd1
-0.025
dele1
0.143
krr1
-0.025
emp1
0.137
hnrnpa0b
-0.025
itpkb
0.135
nfil3-5
-0.025
ccl38a.3
0.127
rps27.1
-0.025
LOC103910120
0.127
sec61g
-0.024
si:dkeyp-44d3.5
0.127
rpl29
-0.024
XLOC-015922
0.127
si:ch73-1a9.3
-0.024
BX537263.2
0.126
rpl32
-0.024
tmeff2a
0.125
kmt5c
-0.023
AL954138.1
0.125
dynll1
-0.023
grk7a
0.125
psmb3
-0.023
crybb1l3
0.124
hmga1a
-0.023