Daniocell
dele1 (all cells)
DAP3 binding cell death enhancer 1
ZFIN
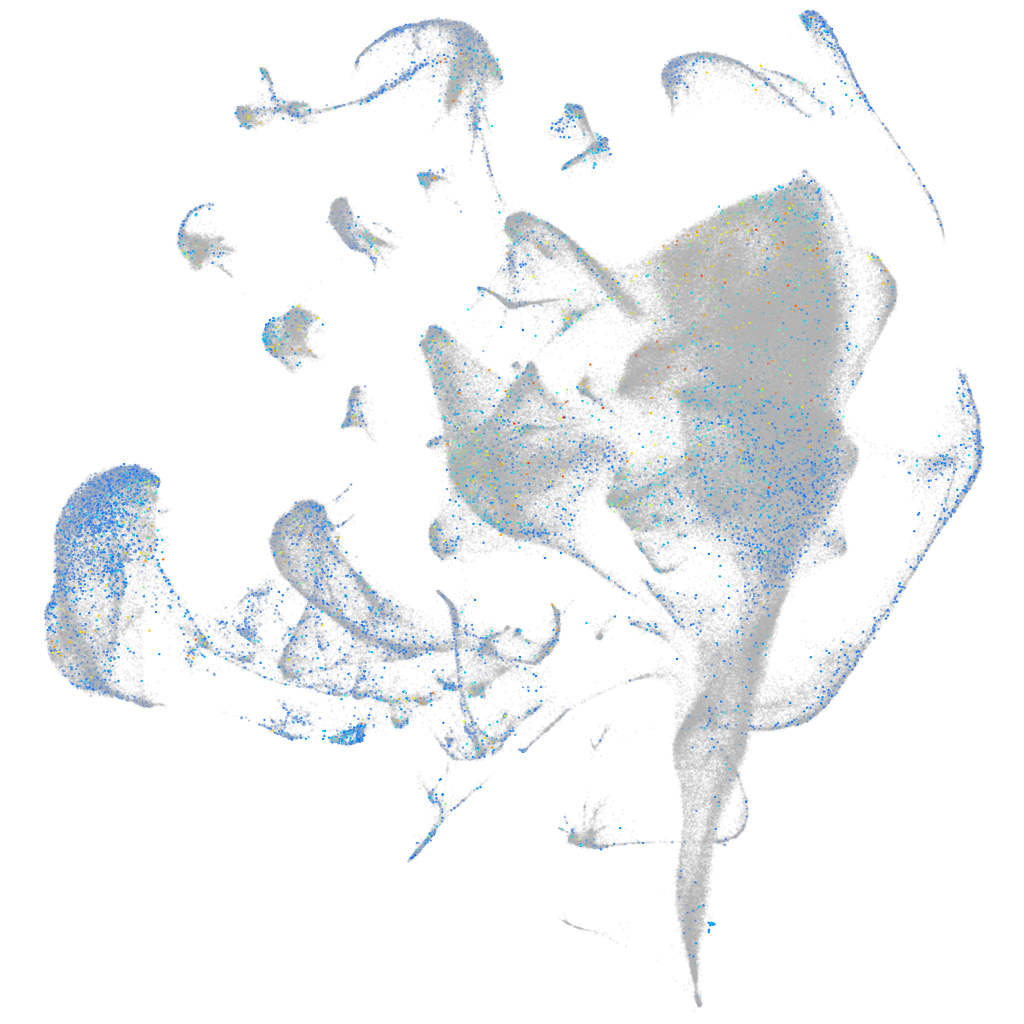
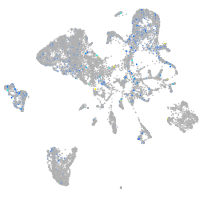
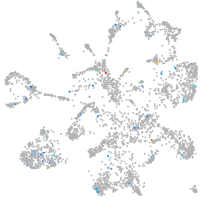
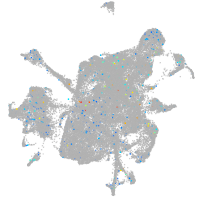
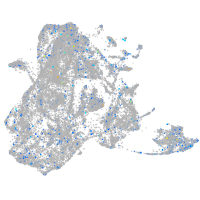
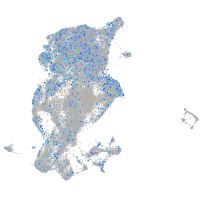
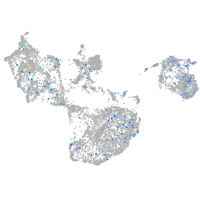
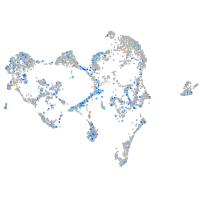
Gene expression UMAP
Display:
Expression
Stage
Other cell groups
all cells
blastomeres
PGCs
endoderm
axial mesoderm
muscle
mural cells /
non-skeletal muscle
mesenchyme
hematopoietic /
vasculature
pronephros
neural
spinal cord / glia
eye
taste / olfactory
otic / lateral line
epidermis
periderm
fin
ionocytes / mucous
pigment cells
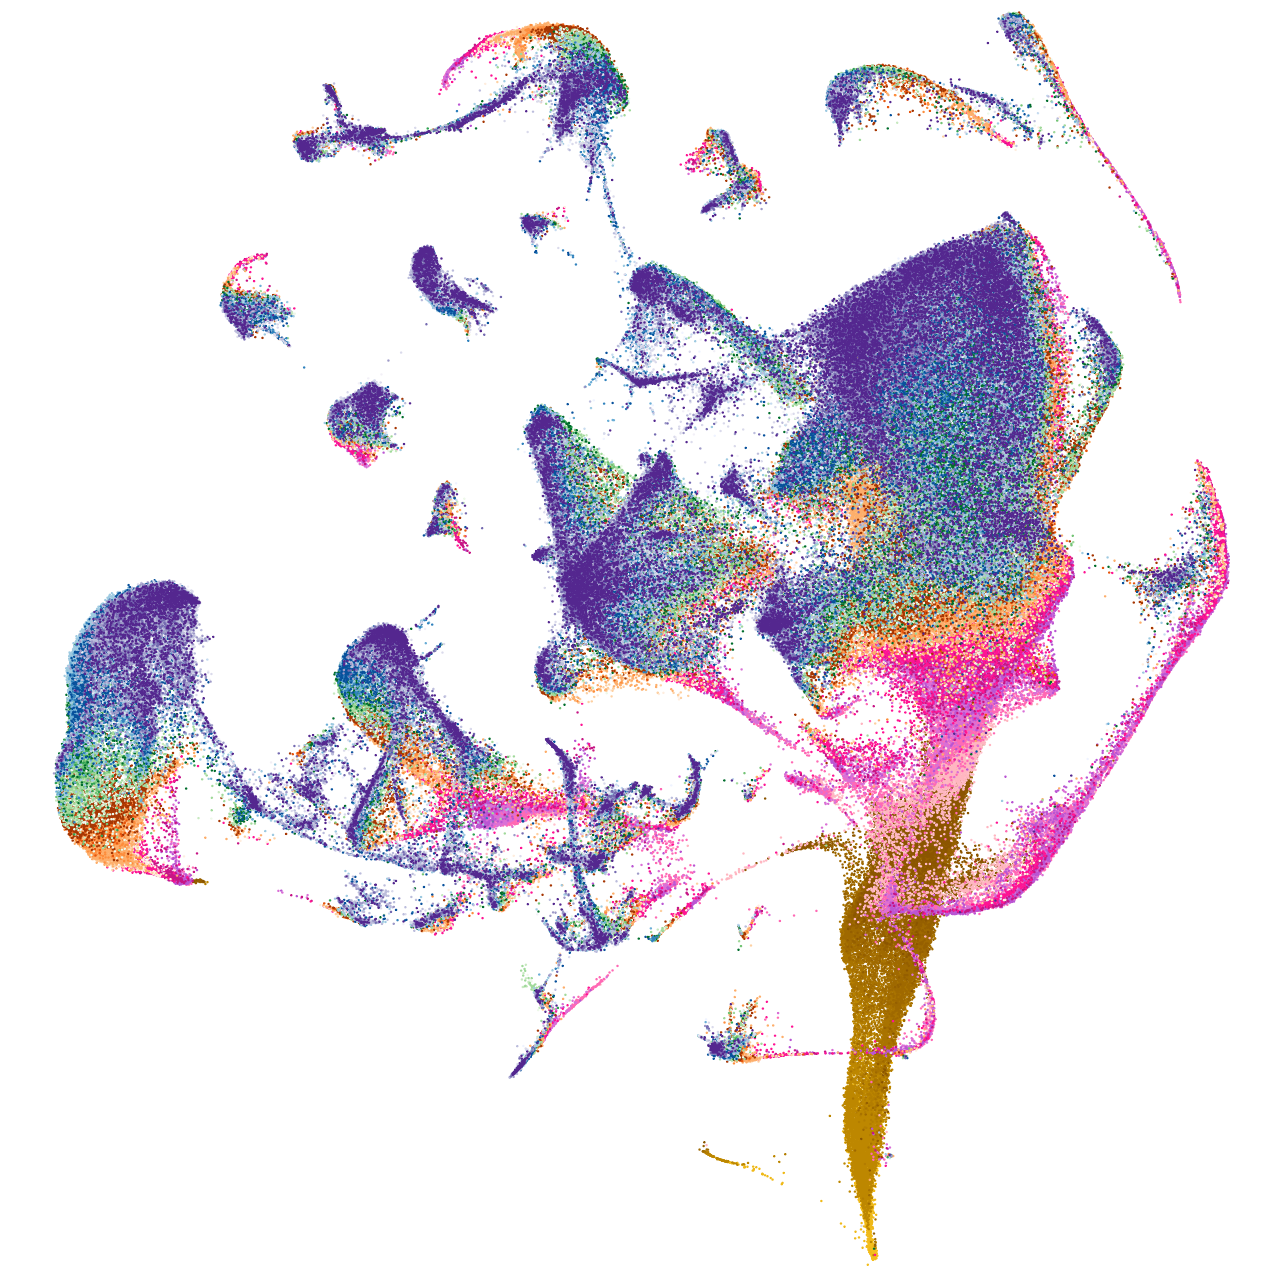
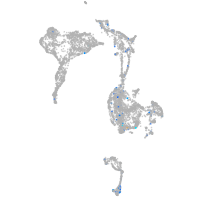
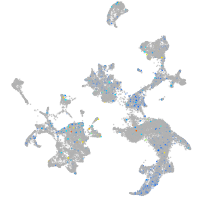
Expression by stage/cluster
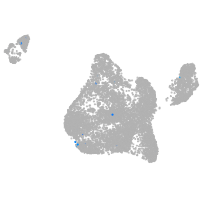
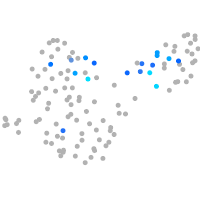
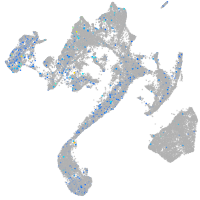
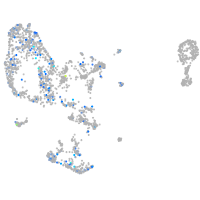
Correlated gene expression
Positive correlation
Negative correlation
Gene
r
Gene
r
si:dkey-247k7.2
0.090
hmgb1b
-0.061
fuca1.1
0.087
marcksb
-0.061
si:ch211-207n23.2
0.087
si:ch211-288g17.3
-0.061
nqo1
0.086
nucks1a
-0.054
zgc:111983
0.085
si:dkey-56m19.5
-0.054
spint2
0.084
hmgb3a
-0.051
cldnb
0.083
hnrnpa0a
-0.051
cldne
0.083
nova2
-0.050
selenow2b
0.083
tuba1a
-0.049
scel
0.082
si:ch211-137a8.4
-0.048
apodb
0.081
tuba1c
-0.048
si:ch211-195b11.3
0.081
chd4a
-0.047
si:ch73-52f15.5
0.081
hnrnpa1a
-0.047
soul2
0.081
sox11b
-0.047
prr13
0.080
seta
-0.046
pycard
0.080
hp1bp3
-0.045
si:dkey-87o1.2
0.080
hnrnpub
-0.044
cox17
0.079
elavl3
-0.043
epdl1
0.079
nono
-0.042
mgst1.2
0.079
tmeff1b
-0.042
cd9b
0.078
tp53inp2
-0.042
eef1da
0.078
tubb5
-0.042
tlcd1
0.078
zc4h2
-0.042
tmem176l.4
0.078
hdac1
-0.041
dhrs13a.2
0.077
smarce1
-0.041
krt17
0.077
top1l
-0.041
abcb5
0.076
cx43.4
-0.040
stard14
0.076
h2afva
-0.040
stx11b.1
0.076
mex3b
-0.040
si:ch211-79k12.1
0.075
si:dkey-276j7.1
-0.040
tmem45b
0.075
tmpob
-0.040
wu:fa03e10
0.075
marcksl1a
-0.040
wu:fb18f06
0.075
gpm6aa
-0.039
si:dkeyp-51b9.3
0.074
sox11a
-0.039
cldn23a
0.073
ewsr1a
-0.038