Daniocell
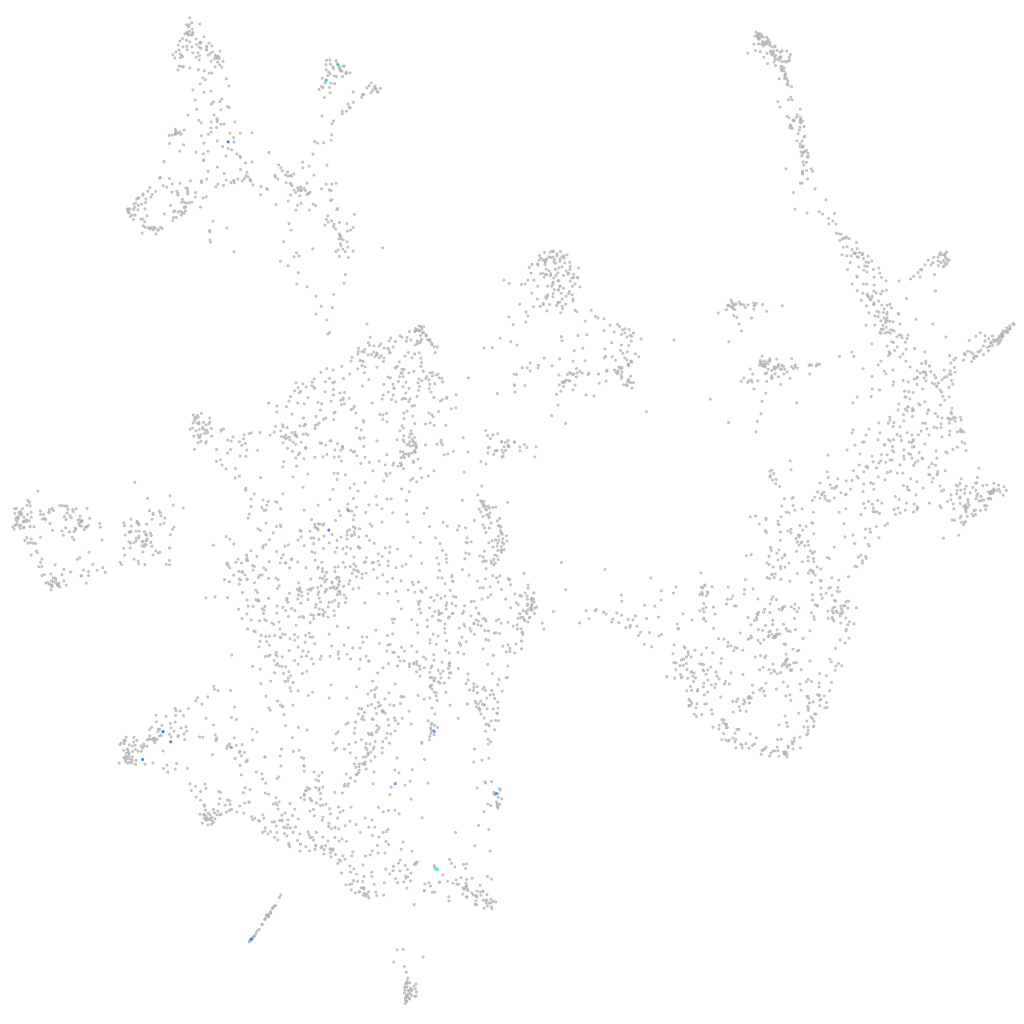
si:ch211-59h6.1 (otic / lateral line)
si:ch211-59h6.1
ZFIN
Gene expression UMAP
Display:
Expression
Stage
Other cell groups
all cells
blastomeres
PGCs
endoderm
axial mesoderm
muscle
mural cells /
non-skeletal muscle
mesenchyme
hematopoietic /
vasculature
pronephros
neural
spinal cord / glia
eye
taste / olfactory
otic / lateral line
epidermis
periderm
fin
ionocytes / mucous
pigment cells
Expression by stage/cluster
Correlated gene expression
Positive correlation
Negative correlation
Gene
r
Gene
r
gja8a
0.362
rpl15
-0.044
cideb
0.330
rpl36a
-0.044
BX323586.3
0.313
rplp1
-0.042
si:ch211-38m6.7
0.298
rps28
-0.041
si:ch211-87j1.4
0.294
ola1
-0.041
or103-1
0.294
nsa2
-0.039
XLOC-023755
0.274
tmsb4x
-0.039
LOC103911479
0.248
rps25
-0.038
sgk2b
0.243
rps14
-0.037
LO017850.1
0.232
ptmab
-0.036
LOC100002266.1
0.224
si:dkey-151g10.6
-0.036
dram2a
0.207
rpl14
-0.036
XLOC-005216
0.206
si:ch211-39i22.1
-0.036
ntrk3a
0.201
zgc:114188
-0.035
XLOC-043910
0.195
rps6
-0.034
synpo2b
0.191
rps17
-0.034
AL935166.1
0.190
cldn7b
-0.033
si:ch211-235f1.3
0.185
rpl35a
-0.033
rimbp2
0.180
rpl9
-0.033
SH3TC1
0.179
ywhaz
-0.032
LOC103909783
0.178
capza1a
-0.032
gpr17
0.177
krt18b
-0.032
CU855688.2
0.176
rpl30
-0.032
BX640537.2
0.170
wu:fb18f06
-0.031
cacng7b
0.167
cyt1
-0.031
si:ch211-122l14.7
0.165
CABZ01072614.1
-0.031
pimr171
0.162
ppiaa
-0.030
CU571398.1
0.159
rpl24
-0.030
cx47.1
0.157
ilf2
-0.030
BX784023.1
0.157
apex1
-0.030
selenop
0.156
rps12
-0.030
ccdc149a
0.155
rpl23a
-0.029
nadsyn1
0.155
tma7
-0.029
wnt6a
0.151
gsnb
-0.029
LOC100537992
0.147
dnase1l4.1
-0.029