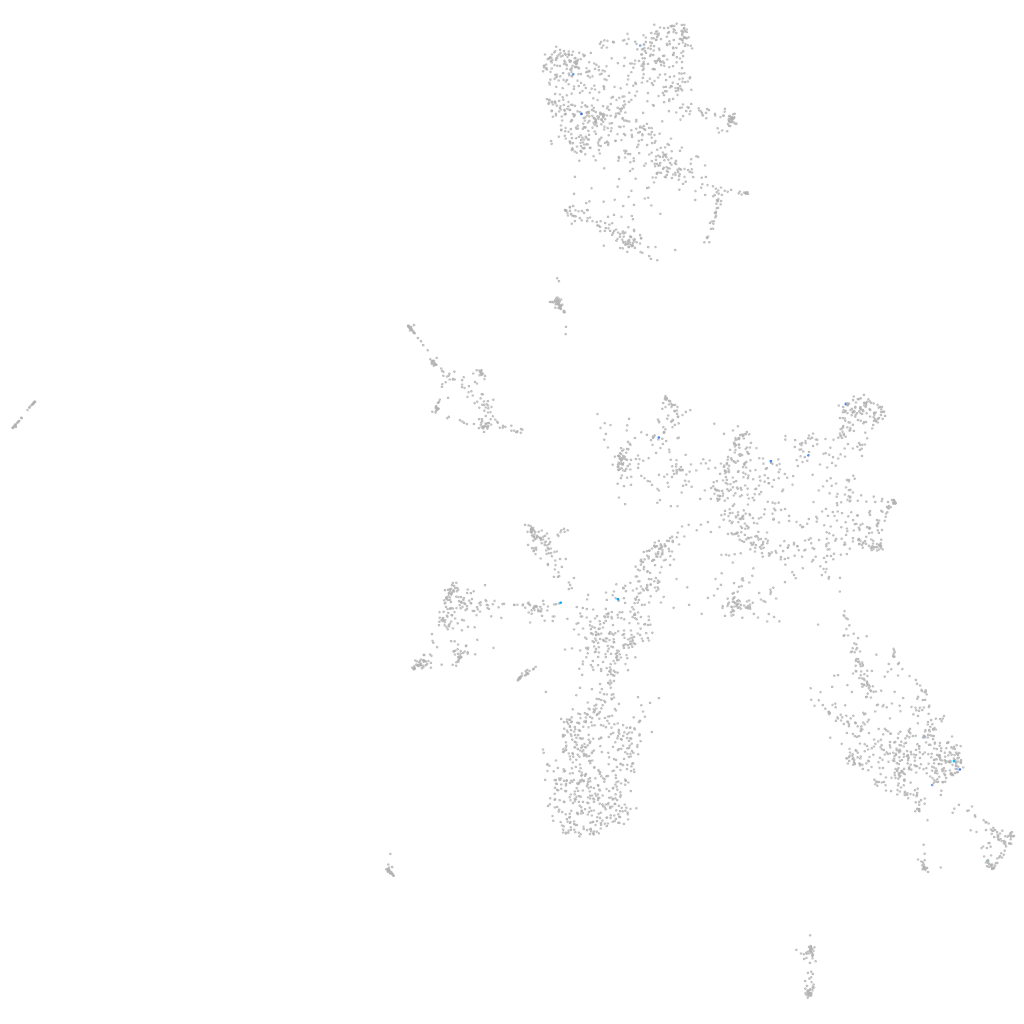
Daniocell
si:ch211-59h6.1 (taste / olfactory)
si:ch211-59h6.1
ZFIN
Gene expression UMAP
Display:
Expression
Stage
Other cell groups
all cells
blastomeres
PGCs
endoderm
axial mesoderm
muscle
mural cells /
non-skeletal muscle
mesenchyme
hematopoietic /
vasculature
pronephros
neural
spinal cord / glia
eye
taste / olfactory
otic / lateral line
epidermis
periderm
fin
ionocytes / mucous
pigment cells
Expression by stage/cluster
Correlated gene expression
Positive correlation
Negative correlation
Gene
r
Gene
r
slc2a15b
0.539
sf3a2
-0.036
BX571762.1
0.511
mcts1
-0.031
znf994
0.488
eif5b
-0.031
BX000460.1
0.417
psmc4
-0.030
si:ch211-39f2.3
0.417
hmgn3
-0.030
LOC100005512
0.361
atp5po
-0.029
CABZ01056637.1
0.361
ptges3b
-0.029
LOC108181407
0.356
polr2f
-0.029
dnai1.1
0.344
pfdn5
-0.029
CR848749.2
0.335
btf3l4
-0.028
zgc:173480
0.312
rcc2
-0.028
RF00151
0.292
psmd11a
-0.027
BX248511.1
0.290
psmb6
-0.027
XLOC-004644
0.262
txnl1
-0.027
XLOC-026773
0.261
minos1
-0.026
sh2d3cb
0.239
aimp2
-0.026
LOC103911582
0.224
psip1b
-0.026
si:ch211-173d10.4
0.224
nfyc
-0.025
BX323067.1
0.221
supt4h1
-0.025
LOC103910738
0.210
lsm4
-0.025
CABZ01090041.1
0.209
psmb3
-0.025
mhc2b
0.208
ube2e3
-0.025
CCKBR
0.204
phf5a
-0.025
FO393424.1
0.204
gdi2
-0.024
BX323459.1
0.203
myl12.2
-0.024
hrh2b
0.203
cyt1l
-0.024
cnnm4a
0.199
supt16h
-0.024
CR450836.1
0.197
cdkn1bb
-0.024
XLOC-002671
0.188
bsg
-0.024
LO018011.1
0.184
cmtm6
-0.024
BX248410.3
0.181
bcl7a
-0.024
zgc:175135
0.181
ndufb2
-0.024
LOC110439549
0.181
selenof
-0.024
znf1096
0.173
pitpnb
-0.024
pkd2
0.172
COX7A2 (1 of many)
-0.023