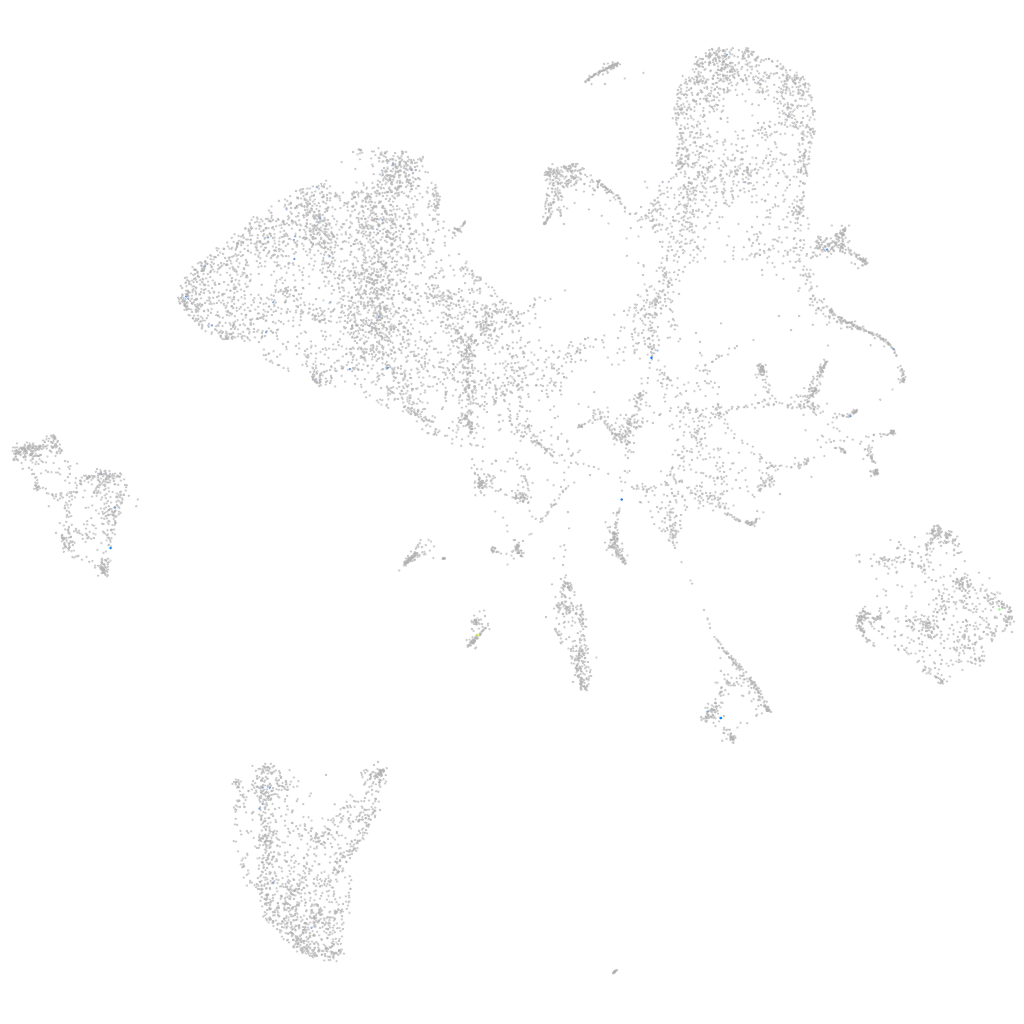
Daniocell
si:ch211-59h6.1 (endoderm)
si:ch211-59h6.1
ZFIN
Gene expression UMAP
Display:
Expression
Stage
Other cell groups
all cells
blastomeres
PGCs
endoderm
axial mesoderm
muscle
mural cells /
non-skeletal muscle
mesenchyme
hematopoietic /
vasculature
pronephros
neural
spinal cord / glia
eye
taste / olfactory
otic / lateral line
epidermis
periderm
fin
ionocytes / mucous
pigment cells
Expression by stage/cluster
Correlated gene expression
Positive correlation
Negative correlation
Gene
r
Gene
r
si:dkey-88n24.5
0.284
bcas2
-0.018
LOC101883766
0.251
zgc:101744
-0.018
cnga3a
0.243
ssr1
-0.017
crygm2d15
0.235
plac8.1
-0.016
AL935186.9.1
0.235
tgif1
-0.016
AL845295.1
0.231
irf2a
-0.016
BX914214.1
0.222
smarcd1
-0.016
BX469908.1
0.201
sec61b
-0.016
zgc:153499
0.185
pinx1
-0.015
gnb1l
0.178
stoml3b
-0.015
si:ch73-170d6.4
0.157
acin1a
-0.015
LOC110437974
0.152
zfand6
-0.015
ifnphi3
0.152
eif4ebp3l
-0.015
nek2
0.147
sltm
-0.015
LOC103908923
0.146
apoa1a
-0.015
XLOC-036361
0.143
pnisr
-0.015
slc5a12
0.138
cul3a
-0.015
tdrd6
0.138
rtn4b
-0.015
CR848025.1
0.137
map3k7
-0.015
LOC103910996
0.136
cdh6
-0.015
SRMS
0.135
si:ch211-71m22.1
-0.015
bricd5
0.135
pvalb1
-0.014
BX649416.1
0.131
kdm5c
-0.014
si:dkeyp-80c12.7
0.129
phax
-0.014
ebf1b
0.128
ddx47
-0.014
CT027611.1
0.119
CR293507.1
-0.014
LOC103909616
0.117
cstf3
-0.014
AL953894.1
0.110
carhsp1
-0.014
zp2.2
0.107
rhoac
-0.014
tpgs2
0.107
dhx16
-0.014
LOC110438610
0.105
si:ch211-133l5.7
-0.014
XLOC-005216
0.104
gnl3l
-0.014
LOC101885857
0.104
wu:fb59d01
-0.014
si:ch211-147g22.7
0.103
dhx9
-0.014
zgc:171220
0.103
u2af1
-0.014