Daniocell
si:ch211-59h6.1 (fin)
si:ch211-59h6.1
ZFIN
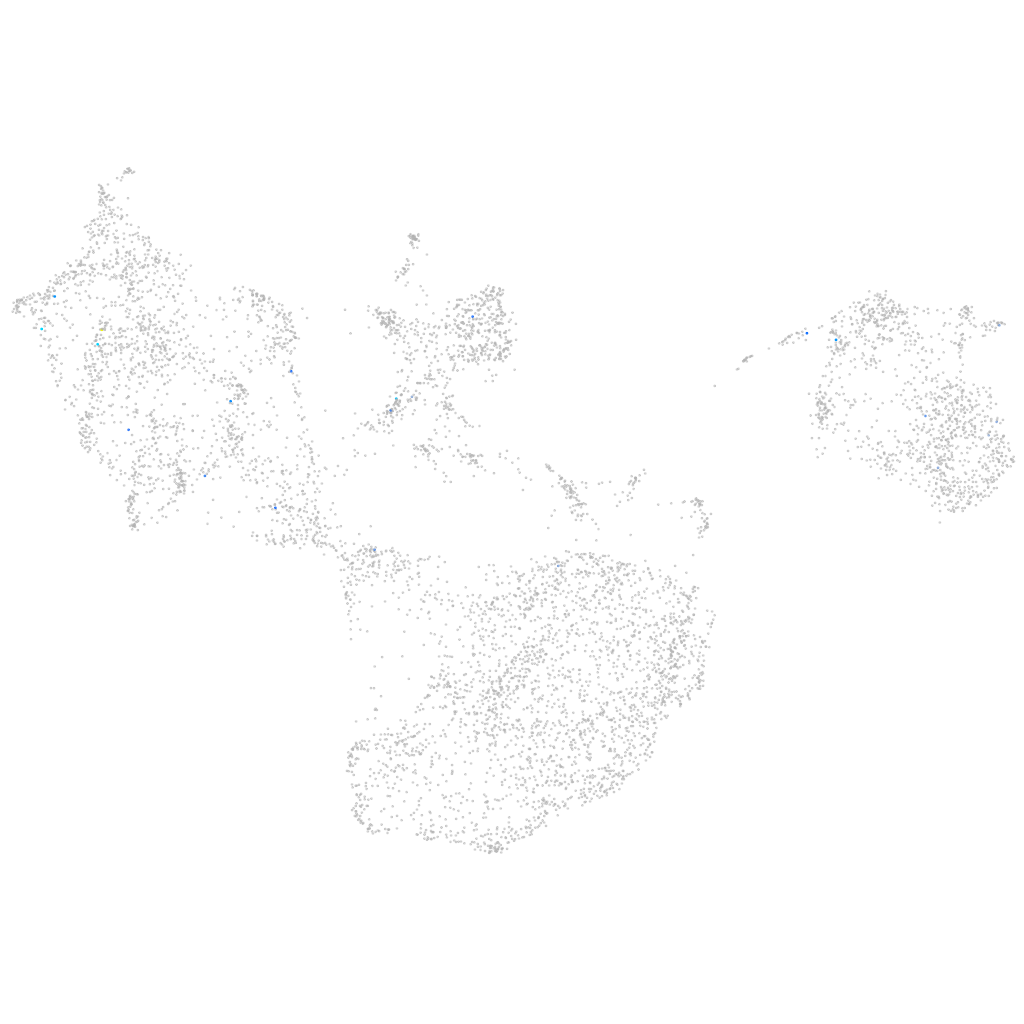
Gene expression UMAP
Display:
Expression
Stage
Other cell groups
all cells
blastomeres
PGCs
endoderm
axial mesoderm
muscle
mural cells /
non-skeletal muscle
mesenchyme
hematopoietic /
vasculature
pronephros
neural
spinal cord / glia
eye
taste / olfactory
otic / lateral line
epidermis
periderm
fin
ionocytes / mucous
pigment cells
Expression by stage/cluster
Correlated gene expression
Positive correlation
Negative correlation
Gene
r
Gene
r
BX649388.3
0.394
tmsb1
-0.037
CU929206.2
0.346
epcam
-0.036
XLOC-022129
0.319
cldni
-0.035
CR626944.1
0.297
actb1
-0.035
ptf1a
0.288
egfl6
-0.035
XLOC-004189
0.265
s100a10b
-0.035
LOC108191315
0.244
apoeb
-0.035
srfb
0.241
tagln2
-0.035
ftr91
0.232
krt8
-0.035
si:dkey-176f19.7
0.223
and3
-0.034
trpc2b
0.216
tmsb4x
-0.033
LOC101882086
0.213
thy1
-0.033
pnp6
0.199
cfl1l
-0.032
CABZ01043953.1.1
0.189
zgc:92380
-0.032
AL831745.1
0.184
si:dkey-102c8.3
-0.031
LOC110438517
0.178
col18a1a
-0.031
lbx1b
0.175
abracl
-0.031
mss51
0.170
pfn1
-0.031
si:dkey-31j3.11
0.160
ywhaz
-0.030
pimr180
0.158
cyt1
-0.030
LOC108192020
0.158
zgc:86896
-0.030
LO018585.1
0.158
si:dkey-248g15.3
-0.030
itgae.1
0.157
s100v2
-0.030
BX936393.1
0.152
cldn1
-0.029
BX005368.1
0.146
ptgdsb.1
-0.029
ankmy1
0.145
csrp1a
-0.029
foxe3
0.144
myh9a
-0.029
sdhaf1
0.142
arpc4
-0.028
gramd1bb
0.142
spaca4l
-0.028
ankrd52b
0.141
ahnak
-0.028
cyp2aa2
0.141
spint1a
-0.028
CU929416.1
0.141
cotl1
-0.028
AL845362.1
0.137
atp1b3a
-0.028
si:ch211-14a17.6
0.134
GCA
-0.028
LOC108183600
0.130
krt4
-0.027