Daniocell
si:ch211-59h6.1 (eye)
si:ch211-59h6.1
ZFIN
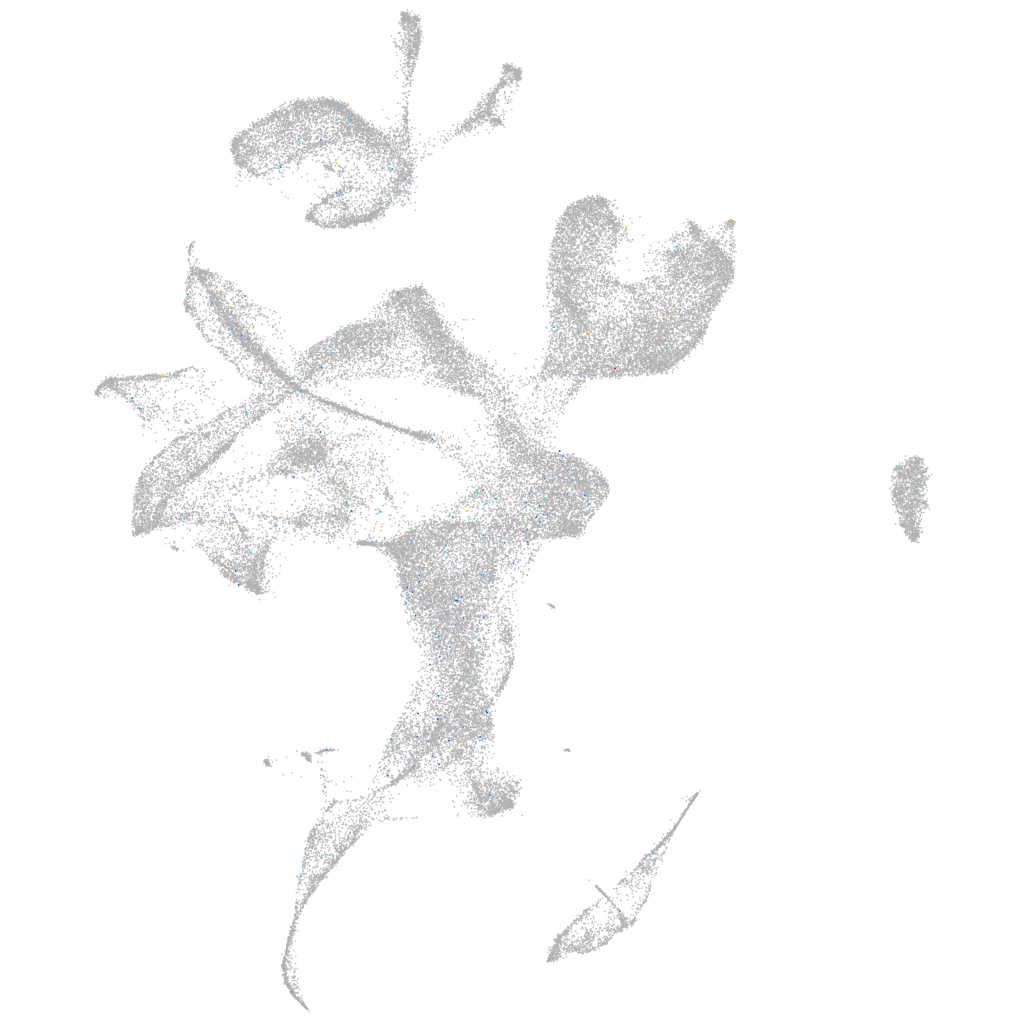
Gene expression UMAP
Display:
Expression
Stage
Other cell groups
all cells
blastomeres
PGCs
endoderm
axial mesoderm
muscle
mural cells /
non-skeletal muscle
mesenchyme
hematopoietic /
vasculature
pronephros
neural
spinal cord / glia
eye
taste / olfactory
otic / lateral line
epidermis
periderm
fin
ionocytes / mucous
pigment cells
Expression by stage/cluster
Correlated gene expression
Positive correlation
Negative correlation
Gene
r
Gene
r
bcl3
0.138
atp6v1e1b
-0.015
LOC110440167
0.085
gapdhs
-0.015
lgals9l1
0.084
ckbb
-0.015
zmp:0000001031
0.080
si:dkey-56f14.7
-0.014
pimr141
0.077
cplx4a
-0.014
acot22
0.072
snap25b
-0.014
LOC101882032
0.072
si:dkey-16p21.8
-0.013
ampd2a
0.072
sh3gl2a
-0.013
XLOC-003136
0.072
cox7a2a
-0.013
XLOC-006273
0.062
krtt1c19e
-0.013
mhc1uka
0.060
syt5b
-0.013
si:ch211-182p11.1
0.056
gpia
-0.012
gcnt3
0.056
scg3
-0.012
FP102921.2
0.056
otx5
-0.012
LOC561873
0.055
tob1b
-0.012
CT573133.1
0.054
tpi1b
-0.012
fam129aa
0.053
atp6v0cb
-0.012
p2ry8
0.052
pkma
-0.012
ppp1r27b
0.050
sypb
-0.011
epsti1
0.050
nrn1lb
-0.011
st8sia4
0.049
si:ch73-256g18.2
-0.011
p2ry1
0.047
calm1a
-0.011
CU459210.1
0.045
npdc1a
-0.011
p2ry12
0.044
nptnb
-0.011
PRLHR
0.043
aldocb
-0.011
si:ch211-173a9.6
0.043
ccdc50
-0.011
si:cabz01023700.1
0.042
ndrg3a
-0.011
LOC103911288
0.042
ndrg2
-0.011
kcnt1
0.042
vamp1
-0.011
si:dkey-185m8.2
0.041
cnrip1b
-0.011
prlh
0.041
eno1a
-0.011
piwil2
0.040
gabarapl2
-0.010
znf1080
0.040
sncgb
-0.010
CT573429.2
0.040
ube2h
-0.010
znf1049
0.039
atpv0e2
-0.010