Daniocell
si:ch211-59h6.1 (hematopoietic / vasculature)
si:ch211-59h6.1
ZFIN
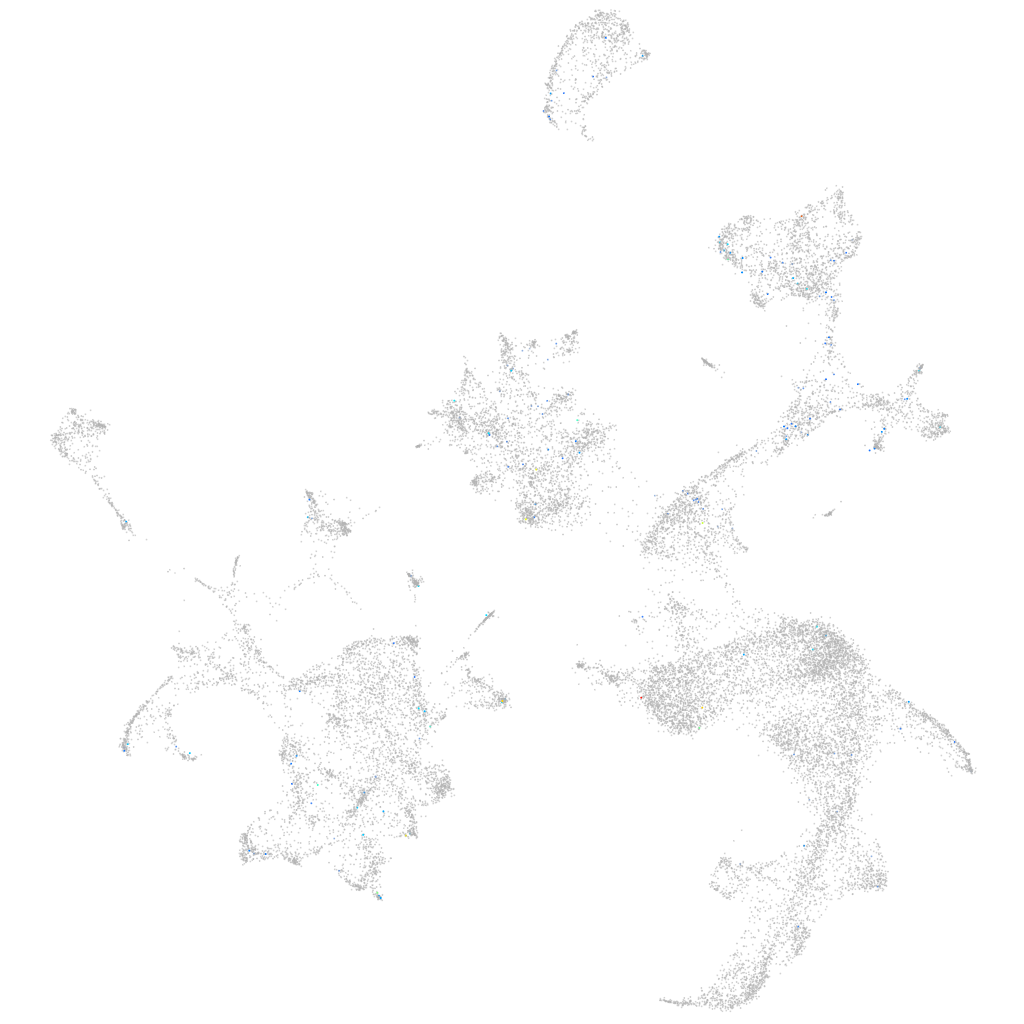
Gene expression UMAP
Display:
Expression
Stage
Other cell groups
all cells
blastomeres
PGCs
endoderm
axial mesoderm
muscle
mural cells /
non-skeletal muscle
mesenchyme
hematopoietic /
vasculature
pronephros
neural
spinal cord / glia
eye
taste / olfactory
otic / lateral line
epidermis
periderm
fin
ionocytes / mucous
pigment cells
Expression by stage/cluster
Correlated gene expression
Positive correlation
Negative correlation
Gene
r
Gene
r
CR394572.1
0.271
hbae1.3
-0.036
cx28.8
0.145
zgc:163057
-0.035
LOC101885216
0.142
cahz
-0.035
CR812836.1
0.140
hbae1.1
-0.034
CR774194.1
0.119
hbbe1.3
-0.032
XLOC-031372
0.118
hbbe1.1
-0.032
zgc:162331
0.113
hbae3
-0.032
LOC110440024
0.112
tspo
-0.032
BX248089.1
0.112
blvrb
-0.031
LOC100007813
0.108
hbbe2
-0.030
tecrl2a
0.103
hemgn
-0.030
LOC110439443
0.102
nt5c2l1
-0.029
XLOC-040516
0.102
hbbe3
-0.028
znf648
0.099
hbbe1.2
-0.027
LOC100535869
0.091
fth1a
-0.024
rsad1
0.090
zgc:56095
-0.024
XLOC-007147
0.089
slc4a1a
-0.024
BX927394.3
0.088
alas2
-0.024
BX537274.1
0.088
gp9
-0.024
cxcl11.1
0.086
hbae5
-0.023
BX323807.1
0.082
si:ch211-207c6.2
-0.022
si:ch211-114l13.1
0.082
nmt1b
-0.022
LOC100330348
0.080
ucp3
-0.022
si:dkey-165n16.5
0.078
fam210b
-0.021
CU694256.1
0.076
hdr
-0.021
upb1
0.076
plac8l1
-0.020
si:ch73-359m17.9
0.075
si:ch211-227m13.1
-0.020
LOC110437912
0.074
tmod4
-0.020
BX005392.3
0.072
znfl2a
-0.020
mxe
0.071
tmem14ca
-0.019
CT990561.2
0.071
creg1
-0.018
kiss1ra
0.070
urod
-0.017
XLOC-013776
0.069
arl4aa
-0.017
XLOC-030786
0.069
fam214b
-0.017
XLOC-023769
0.069
rhd
-0.017