Daniocell
si:ch211-59h6.1 (epidermis)
si:ch211-59h6.1
ZFIN
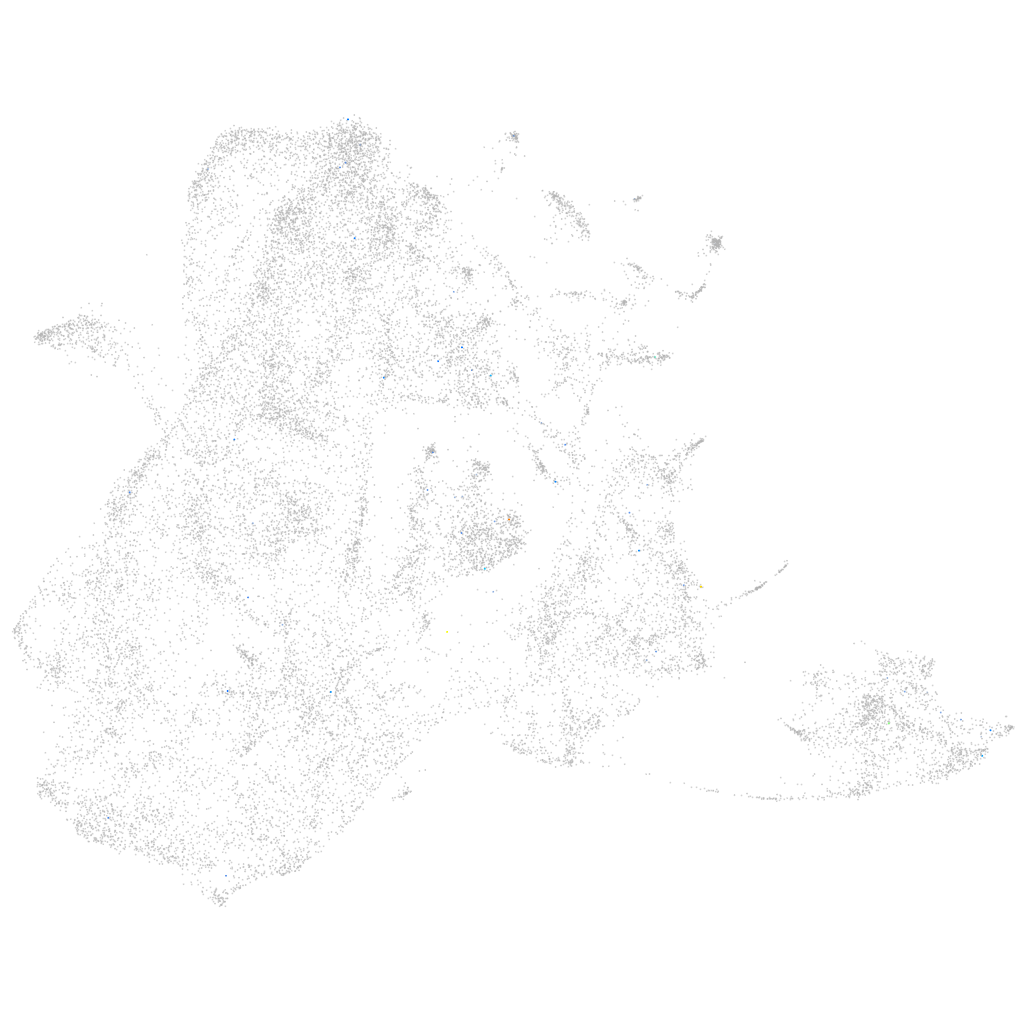
Gene expression UMAP
Display:
Expression
Stage
Other cell groups
all cells
blastomeres
PGCs
endoderm
axial mesoderm
muscle
mural cells /
non-skeletal muscle
mesenchyme
hematopoietic /
vasculature
pronephros
neural
spinal cord / glia
eye
taste / olfactory
otic / lateral line
epidermis
periderm
fin
ionocytes / mucous
pigment cells
Expression by stage/cluster
Correlated gene expression
Positive correlation
Negative correlation
Gene
r
Gene
r
LO017700.2
0.436
cyt1l
-0.026
SGCZ
0.316
rplp1
-0.025
si:ch211-130m23.3
0.240
tmsb4x
-0.025
SLCO3A1 (1 of many)
0.240
COX5B
-0.024
BX664625.3
0.233
hdlbpa
-0.024
rhbdl1
0.229
actb1
-0.024
scn12aa
0.228
zgc:153867
-0.023
si:dkey-83f18.9
0.224
col18a1a
-0.023
XLOC-001115
0.221
rps20
-0.022
LOC101886838
0.217
rps14
-0.022
trpc1
0.214
rplp2l
-0.021
LOC101882303
0.213
spaca4l
-0.020
CABZ01029422.1
0.209
krt8
-0.020
cacna2d3
0.209
myl12.1
-0.020
asic4a
0.201
actb2
-0.020
kcnq2b
0.195
dynll1
-0.019
pcdh1g31
0.193
gsnb
-0.019
XLOC-006820
0.183
sub1a
-0.019
XLOC-037952
0.181
capza1a
-0.019
CEP170B (1 of many)
0.178
COX7A2 (1 of many)
-0.019
RIMS2
0.172
ecrg4b
-0.019
slc12a5a
0.170
rps24
-0.019
LOC110439013
0.170
pfn1
-0.019
mmp17a
0.166
plecb
-0.018
si:dkeyp-82a1.4
0.163
rpl26
-0.018
klhl17
0.162
rps19
-0.018
cers1
0.162
sdr16c5a
-0.018
si:ch211-13f8.1
0.157
rps10
-0.018
LOC110438361
0.157
gng5
-0.018
si:ch211-282j17.10
0.157
ywhae1
-0.018
ephb2a
0.155
rps27a
-0.018
LOC108181592
0.154
col5a1
-0.017
TC2N
0.154
padi2
-0.017
lingo4b
0.151
pabpc1b
-0.017
gabra5
0.151
rps15
-0.017