Daniocell
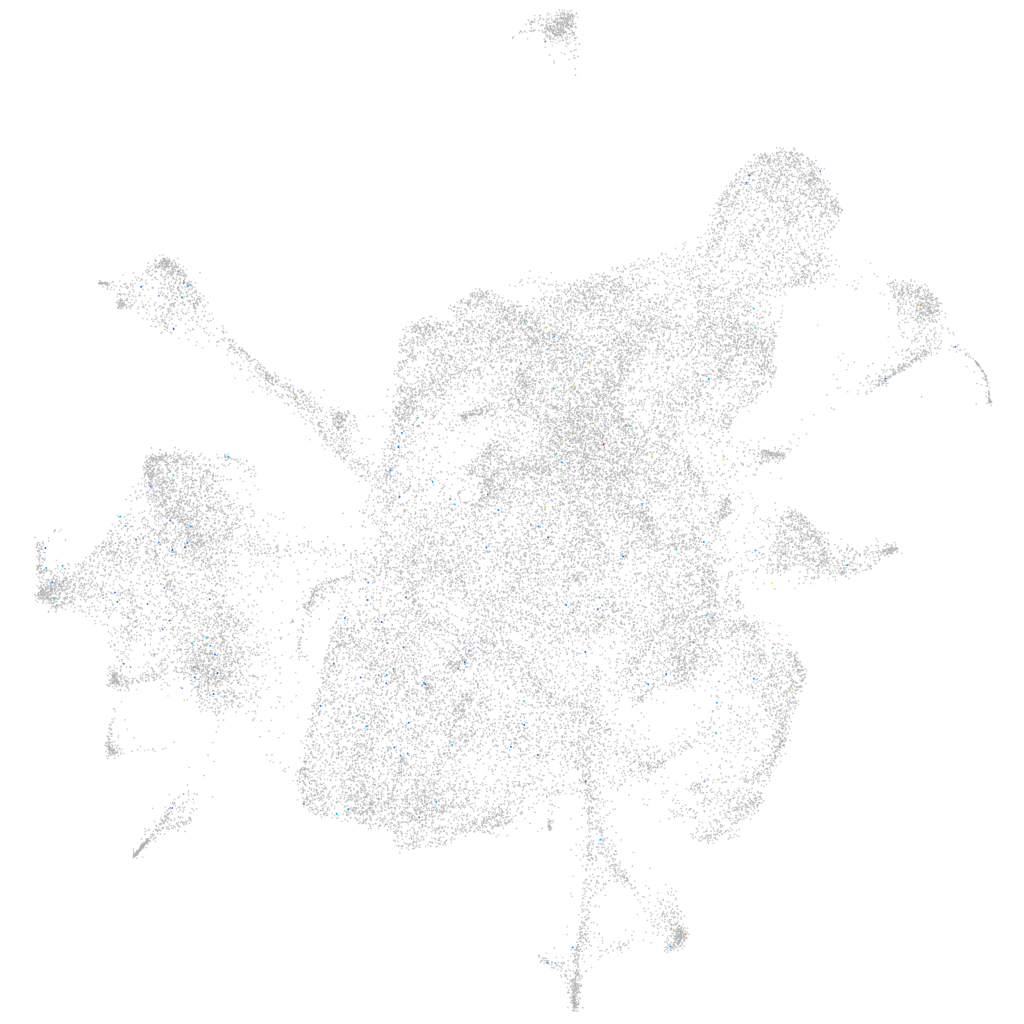
si:ch211-59h6.1 (mesenchyme)
si:ch211-59h6.1
ZFIN
Gene expression UMAP
Display:
Expression
Stage
Other cell groups
all cells
blastomeres
PGCs
endoderm
axial mesoderm
muscle
mural cells /
non-skeletal muscle
mesenchyme
hematopoietic /
vasculature
pronephros
neural
spinal cord / glia
eye
taste / olfactory
otic / lateral line
epidermis
periderm
fin
ionocytes / mucous
pigment cells
Expression by stage/cluster
Correlated gene expression
Positive correlation
Negative correlation
Gene
r
Gene
r
BX511253.1
0.118
rps15a
-0.014
LOC110439537
0.091
tnc
-0.014
LOC110439956
0.089
si:ch211-246m6.4
-0.013
zgc:195356
0.086
pfn1
-0.013
si:ch211-111e20.1
0.084
CR381618.1
-0.013
si:dkey-19a16.11
0.077
rhoab
-0.012
LOC100150116
0.075
quo
-0.012
si:dkey-176f19.4
0.072
si:dkey-222f8.3
-0.012
XLOC-027134
0.071
myhz2
-0.012
si:dkey-163f12.6
0.066
entpd6
-0.012
CR925719.1
0.066
tnnc2
-0.011
rdh5
0.065
tmed9
-0.011
NCKAP1L
0.063
serpinh1b
-0.011
XLOC-029389
0.063
tmsb4x
-0.011
BX465225.1
0.063
col27a1b
-0.010
LOC103910259
0.062
inka1b
-0.010
BX890624.2
0.061
CU929391.2
-0.010
or126-5
0.058
calr3b
-0.010
rad9b
0.057
sost
-0.010
wdr95
0.054
kin
-0.010
zgc:171687
0.053
thbs1b
-0.010
LOC110438160
0.052
isg20
-0.010
XLOC-008420
0.052
si:ch73-334d15.1
-0.010
AL833789.1
0.050
angptl7
-0.010
tdo2b
0.048
pudp
-0.010
si:ch73-359m17.2
0.048
kank2
-0.010
usp18
0.046
f10
-0.010
CABZ01030278.1
0.045
tent5ba
-0.010
XLOC-043568
0.045
robo3
-0.010
si:dkey-91f15.1
0.045
smg1
-0.010
znf1101
0.044
galnt11
-0.010
adgb
0.044
zgc:112102
-0.010
LOC101886997
0.044
ppfibp1a
-0.010
CU896691.1
0.043
pknox2
-0.010
si:ch73-59c19.1
0.043
ccdc85b
-0.010