Daniocell
si:ch211-59h6.1 (neural)
si:ch211-59h6.1
ZFIN
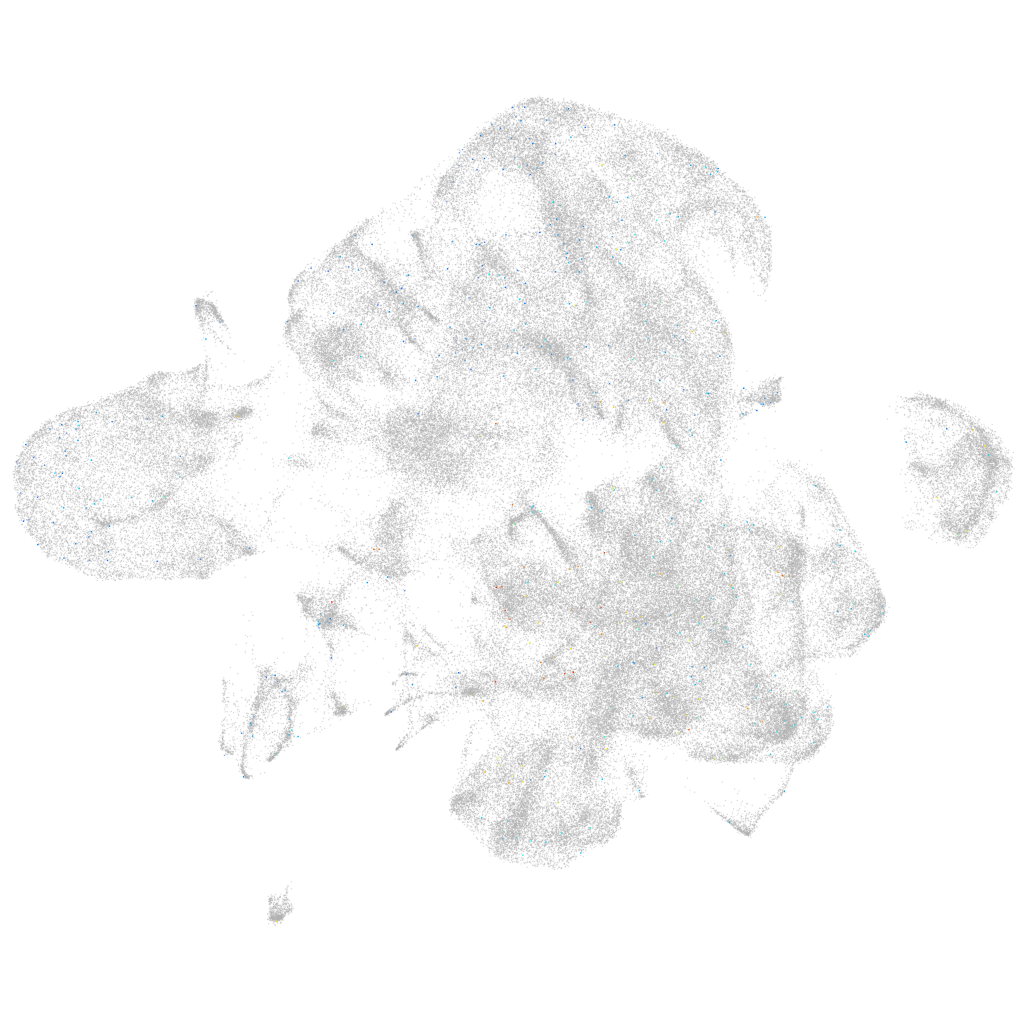
Gene expression UMAP
Display:
Expression
Stage
Other cell groups
all cells
blastomeres
PGCs
endoderm
axial mesoderm
muscle
mural cells /
non-skeletal muscle
mesenchyme
hematopoietic /
vasculature
pronephros
neural
spinal cord / glia
eye
taste / olfactory
otic / lateral line
epidermis
periderm
fin
ionocytes / mucous
pigment cells
Expression by stage/cluster
Correlated gene expression
Positive correlation
Negative correlation
Gene
r
Gene
r
adgre13
0.073
rpl38
-0.017
CABZ01072242.1
0.061
rpl27
-0.015
BX936393.1
0.055
rps29
-0.014
si:dkey-6a5.3
0.054
rpl39
-0.014
si:dkey-1c7.1
0.054
rps27a
-0.013
CR626882.2
0.054
rps28
-0.013
abcg5
0.053
rpl29
-0.013
BX640453.1
0.046
si:dkey-151g10.6
-0.013
si:cabz01068815.1.1
0.045
rpl11
-0.013
si:ch211-204d2.4
0.044
rps12
-0.013
si:ch73-309g22.1
0.042
rps13
-0.013
LOC108182217
0.039
rpl22
-0.013
XLOC-015256
0.039
rpl26
-0.013
si:dkey-78l4.13
0.037
rpl35a
-0.013
si:dkey-246e1.3
0.036
rps21
-0.012
or111-2
0.036
rpl30
-0.012
LOC103909482
0.035
rpl34
-0.012
CABZ01113373.1
0.035
rps15
-0.011
dusp19a
0.035
rpl6
-0.011
CR925777.1
0.033
atp5f1e
-0.011
ptprbl
0.032
rpl13
-0.011
XLOC-042570
0.032
rps25
-0.011
BX950188.1
0.032
rpl8
-0.011
trim110
0.031
eif2s2
-0.011
LOC101884685
0.031
rps24
-0.010
LOC103911884
0.031
apex1
-0.010
efhb
0.030
rps2
-0.010
slc30a8
0.030
rplp2l
-0.010
CR383672.2
0.029
rpl28
-0.010
XLOC-029386
0.028
atp5mc3b
-0.010
LOC101887121
0.028
drap1
-0.010
CR456627.1
0.028
rps26l
-0.010
ltc4s
0.028
ppih
-0.010
CABZ01034698.2
0.027
rps19
-0.009
si:ch73-359m17.9
0.027
polr2l
-0.009