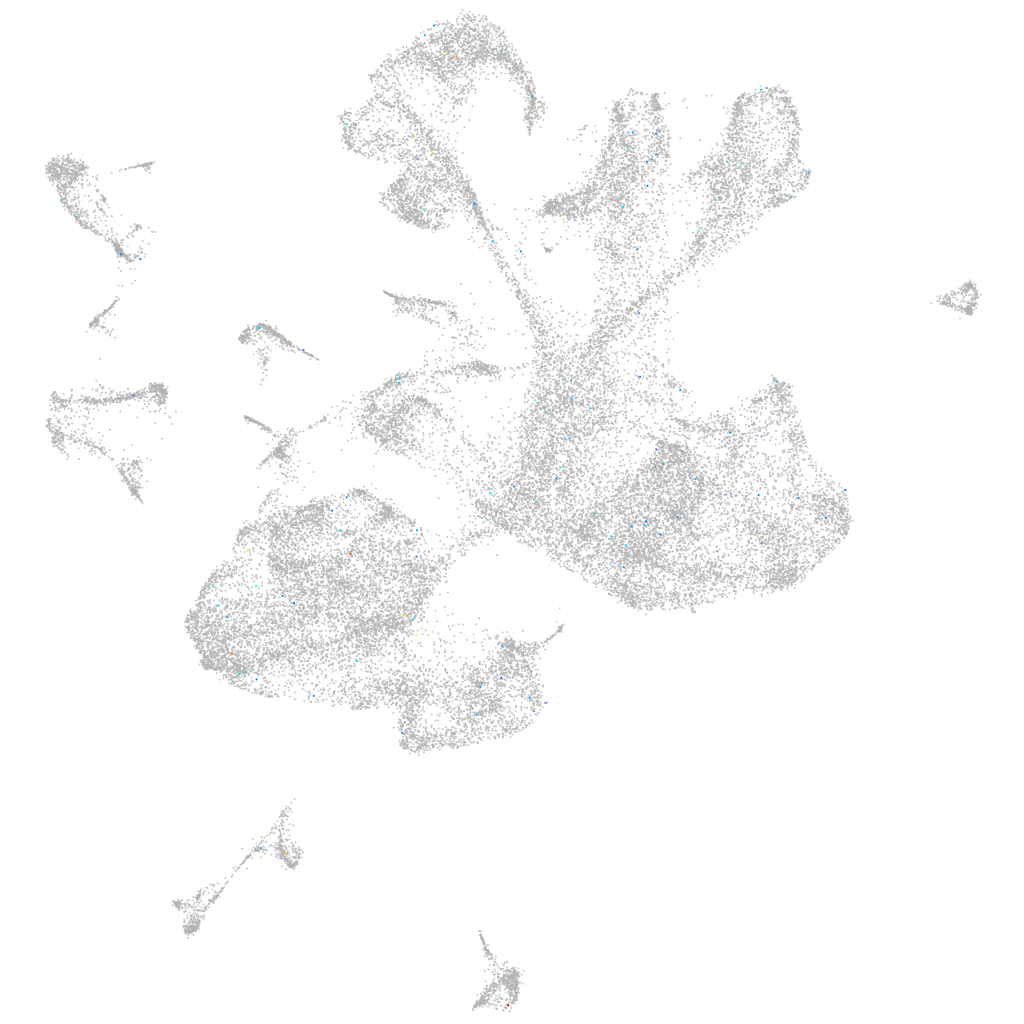
Daniocell
si:ch211-59h6.1 (glial cells / spinal cord)
si:ch211-59h6.1
ZFIN
Gene expression UMAP
Display:
Expression
Stage
Other cell groups
all cells
blastomeres
PGCs
endoderm
axial mesoderm
muscle
mural cells /
non-skeletal muscle
mesenchyme
hematopoietic /
vasculature
pronephros
neural
spinal cord / glia
eye
taste / olfactory
otic / lateral line
epidermis
periderm
fin
ionocytes / mucous
pigment cells
Expression by stage/cluster
Correlated gene expression
Positive correlation
Negative correlation
Gene
r
Gene
r
BX088583.2
0.115
rpl37
-0.021
LOC100334202
0.108
rpl39
-0.018
XLOC-018430
0.106
rps15a
-0.017
CR847895.1
0.101
rpl11
-0.016
LOC110438490
0.093
rpl38
-0.015
CABZ01112050.1
0.092
rps19
-0.015
dre-let-7a-3
0.091
rps26l
-0.014
CU639412.1
0.089
eef1g
-0.014
XLOC-007466
0.083
rps25
-0.013
LOC110439518
0.079
rplp0
-0.013
LOC103908923
0.077
rpl21
-0.013
LOC560447
0.076
eif3ha
-0.013
si:dkey-193n17.9
0.072
rpl36
-0.013
si:dkey-238o14.3
0.067
rps7
-0.013
LOC100536671
0.066
uqcrb
-0.013
BX255917.2
0.065
slc25a5
-0.013
CU672227.1
0.064
rps20
-0.013
BX571712.2
0.064
rps14
-0.013
BX324007.2
0.063
esd
-0.013
acot19
0.062
faua
-0.013
CR339059.1
0.060
arrdc3b
-0.012
c24h18orf63
0.059
rps28
-0.012
AL805905.1
0.059
timm9
-0.012
LOC108190819
0.058
rps12
-0.012
XLOC-009919
0.056
rps16
-0.012
LOC100538118
0.056
rps13
-0.012
LOC108191486
0.054
mkrn4
-0.012
btr05
0.053
atp5f1e
-0.012
igfn1.4
0.051
cdca7a
-0.012
abca4a
0.049
mcm3
-0.012
LOC103910324
0.048
rpl26
-0.012
si:dkey-199m13.7
0.048
rcn2
-0.012
ctss2.1
0.048
rpl36a
-0.012
BX897720.1
0.048
col11a1a
-0.012
znf692
0.047
h1fx
-0.012