Daniocell
hoxa9b (pigment cells)
homeobox A9b
ZFIN
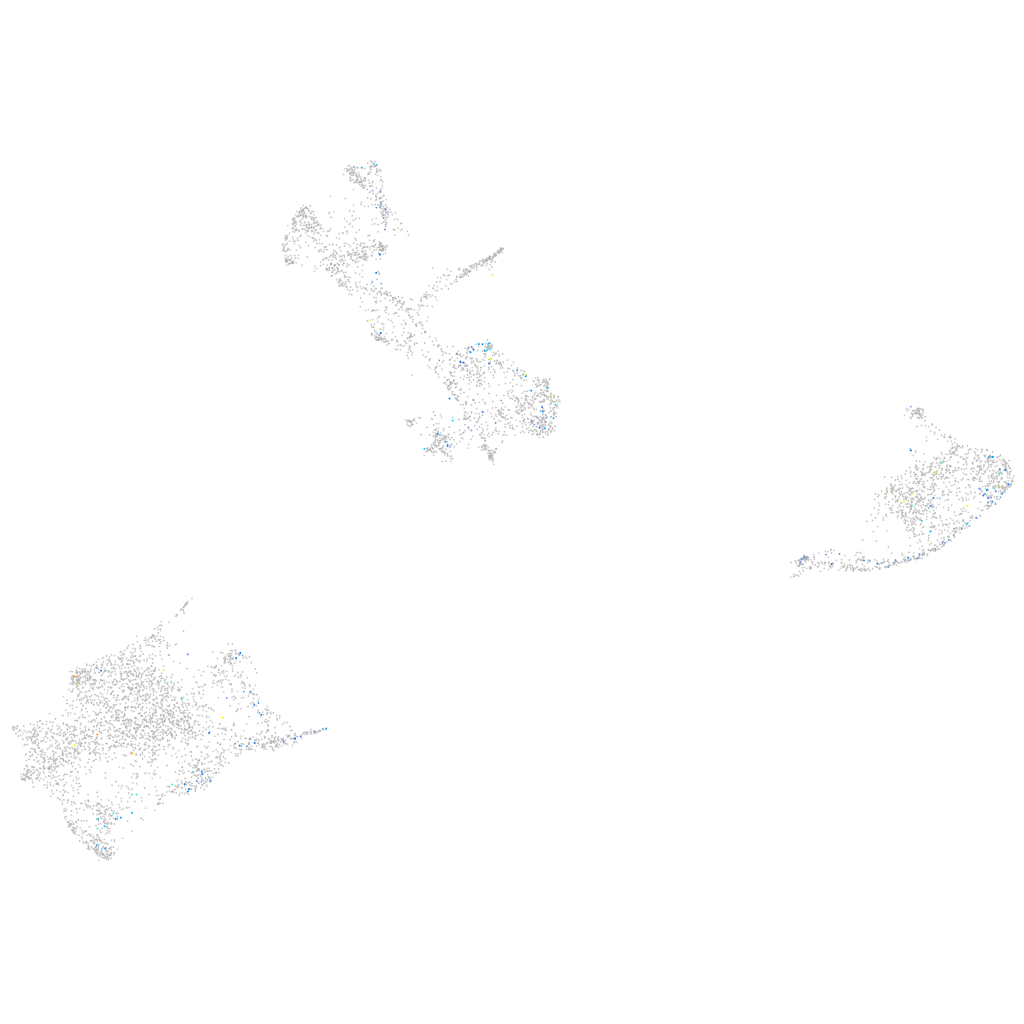
Gene expression UMAP
Display:
Expression
Stage
Other cell groups
all cells
blastomeres
PGCs
endoderm
axial mesoderm
muscle
mural cells /
non-skeletal muscle
mesenchyme
hematopoietic /
vasculature
pronephros
neural
spinal cord / glia
eye
taste / olfactory
otic / lateral line
epidermis
periderm
fin
ionocytes / mucous
pigment cells
Expression by stage/cluster
Correlated gene expression
Positive correlation
Negative correlation
Gene
r
Gene
r
hoxb10a
0.183
uraha
-0.045
CU457819.4
0.143
zgc:110339
-0.044
hoxa10b
0.142
krt18b
-0.036
hoxd12a
0.142
aqp1a.1
-0.034
LOC101884514
0.142
atic
-0.033
si:ch73-103b2.1.1
0.141
prps1a
-0.033
hoxa13b
0.140
prdx5
-0.032
hoxc10a
0.134
zgc:153031
-0.032
si:dkey-217g21.3
0.127
paics
-0.031
zgc:136858
0.125
si:dkey-251i10.2
-0.031
hoxd9a
0.125
defbl1
-0.031
slc8b1
0.122
si:ch211-105c13.3
-0.031
CABZ01040021.1
0.120
bco1
-0.030
hoxc13a
0.116
CABZ01021592.1
-0.030
LOC103910625
0.116
s100v2
-0.030
BX465864.1
0.116
tnnt3b
-0.029
CABZ01118575.1
0.115
gpd1b
-0.029
LO018564.1
0.115
apoda.1
-0.028
LOC110439302
0.114
alx1
-0.027
hoxa9a
0.113
tmem130
-0.027
st3gal1l2
0.112
tgfa
-0.027
XLOC-034167
0.112
akap12a
-0.027
kcnh1b
0.111
impdh1b
-0.027
hoxb9a
0.110
prss59.2
-0.027
plvapb
0.109
rcl1
-0.027
flt1
0.109
si:ch73-366l1.5
-0.027
ccm2l
0.108
si:dkey-73n8.3
-0.026
adgra1a.1
0.107
adsl
-0.026
zfp64
0.107
lypc
-0.026
hoxa11b
0.106
myo5b
-0.026
MGAT5B
0.106
tmem179b
-0.026
LOC101884310
0.106
txn
-0.026
krt98
0.105
si:ch73-89b15.3
-0.025
hoxc11a
0.104
dram2a
-0.025
abr
0.102
neb
-0.025