Daniocell
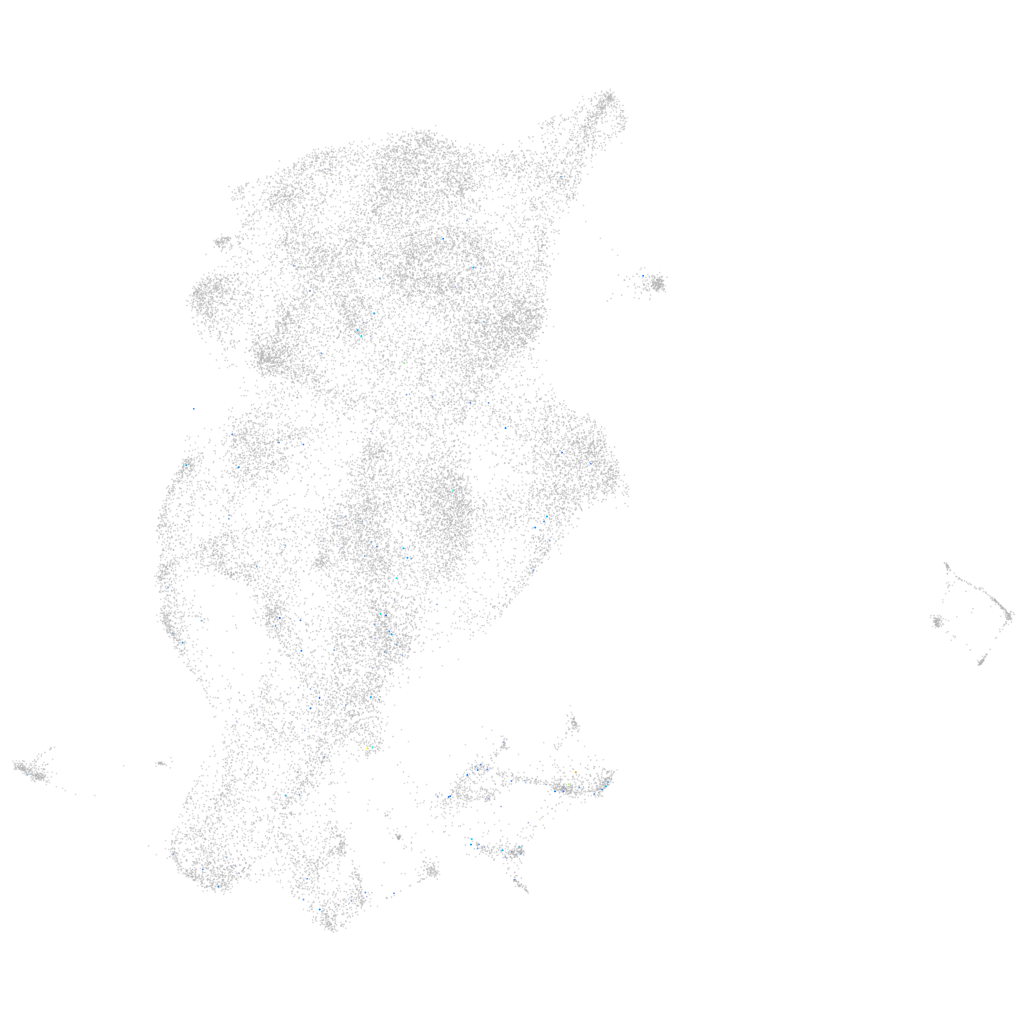
hoxa9b (periderm)
homeobox A9b
ZFIN
Gene expression UMAP
Display:
Expression
Stage
Other cell groups
all cells
blastomeres
PGCs
endoderm
axial mesoderm
muscle
mural cells /
non-skeletal muscle
mesenchyme
hematopoietic /
vasculature
pronephros
neural
spinal cord / glia
eye
taste / olfactory
otic / lateral line
epidermis
periderm
fin
ionocytes / mucous
pigment cells
Expression by stage/cluster
Correlated gene expression
Positive correlation
Negative correlation
Gene
r
Gene
r
LOC101884748
0.180
eef1b2
-0.033
iffo2a
0.173
tdh
-0.030
si:ch211-202h22.10
0.166
krt17
-0.030
LOC108190371
0.159
eevs
-0.030
arhgef40
0.147
mcl1a
-0.028
BX927184.1
0.134
si:ch211-207n23.2
-0.028
syt10
0.133
si:dkey-247k7.2
-0.028
arf3a
0.130
s100v2
-0.028
kcnc2
0.123
rps26l
-0.027
si:ch211-191i18.2
0.122
si:ch211-195b11.3
-0.027
spag6
0.121
ddx21
-0.026
egfl7
0.121
XLOC-011066
-0.026
XLOC-007573
0.118
aldob
-0.025
dlg4a
0.118
krtt1c19e
-0.025
CR769772.3
0.116
rplp0
-0.025
celf5b
0.116
pycard
-0.025
AL928920.3
0.116
rpl22
-0.025
CABZ01071972.1
0.116
rps16
-0.024
hoxa11b
0.115
rpl7
-0.024
marco
0.113
scel
-0.024
CR854827.3
0.112
si:ch73-52f15.5
-0.024
ghrhrb
0.110
tlcd1
-0.024
c1qtnf5
0.109
nupr1a
-0.024
npvf
0.108
selenow2b
-0.023
nrxn3b
0.103
slc25a34
-0.023
plxna4
0.103
rpl38
-0.023
slc6a5
0.101
cyt1
-0.023
hoxb7a
0.101
rpl23
-0.023
tmie
0.100
rhcgl1
-0.023
itga9
0.100
atp5if1b
-0.023
nefmb
0.099
adi1
-0.023
si:ch73-379j16.2
0.098
si:dkeyp-1h4.6
-0.022
glt8d2
0.097
si:dkeyp-51b9.3
-0.022
rrad
0.093
ndufaf2
-0.022
epha4b
0.092
pno1
-0.022