Daniocell
hoxa9b (otic / lateral line)
homeobox A9b
ZFIN
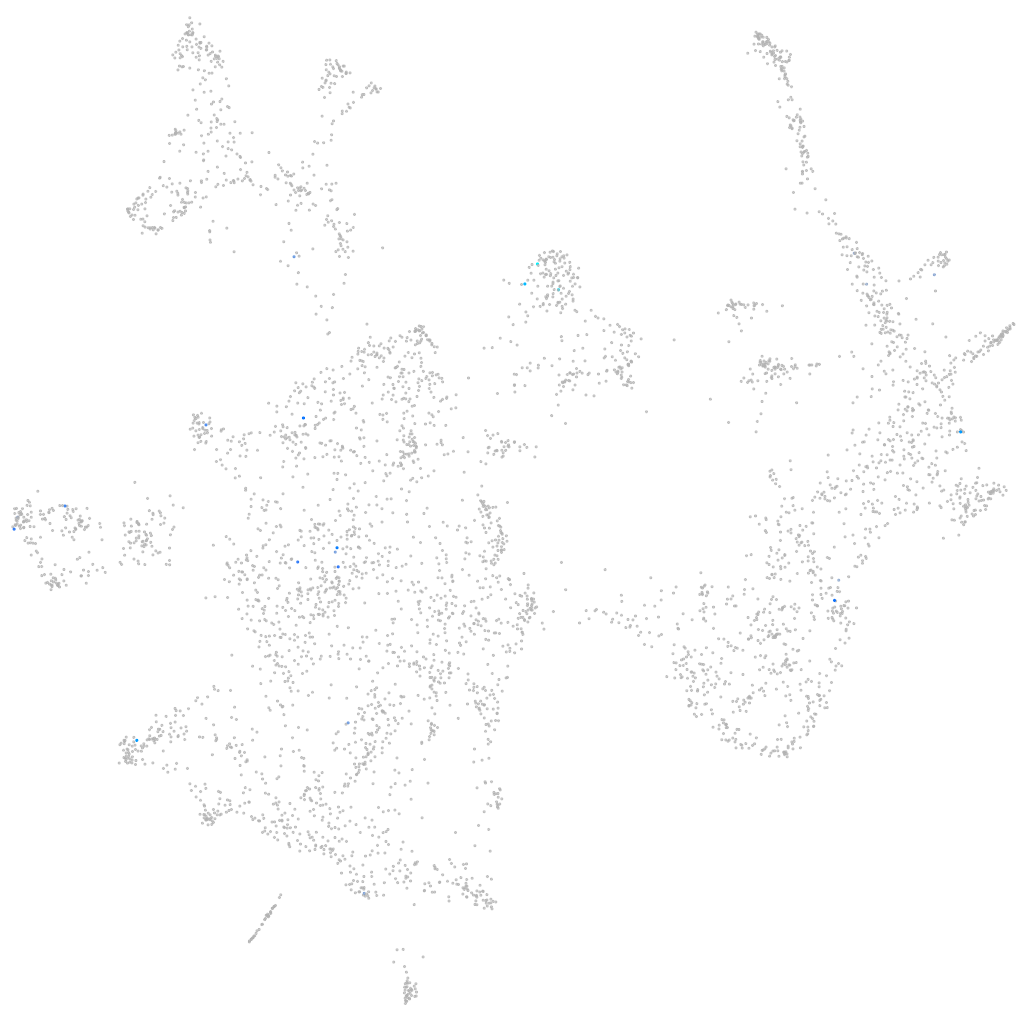
Gene expression UMAP
Display:
Expression
Stage
Other cell groups
all cells
blastomeres
PGCs
endoderm
axial mesoderm
muscle
mural cells /
non-skeletal muscle
mesenchyme
hematopoietic /
vasculature
pronephros
neural
spinal cord / glia
eye
taste / olfactory
otic / lateral line
epidermis
periderm
fin
ionocytes / mucous
pigment cells
Expression by stage/cluster
Correlated gene expression
Positive correlation
Negative correlation
Gene
r
Gene
r
hoxc10a
0.534
jun
-0.039
CT573139.1
0.452
six1b
-0.038
LOC559637
0.421
epcam
-0.038
si:ch211-117c9.2
0.400
si:ch211-152c2.3
-0.035
CABZ01065417.1
0.388
atp1b1a
-0.035
hoxa9a
0.388
CABZ01092156.1
-0.035
LOC103912056
0.363
prdx5
-0.033
si:dkey-33c12.5
0.348
sdc4
-0.032
hoxd10a
0.343
ier2b
-0.031
si:ch211-175m2.4
0.319
STMP1
-0.031
hoxd12a
0.314
romo1
-0.031
hoxd11a
0.313
glod5
-0.030
CU467823.1
0.312
igfbp5b
-0.030
slc30a2
0.307
ufd1l
-0.029
cacng7a
0.303
eci1
-0.029
INSM2
0.297
socs3a
-0.028
XLOC-016165
0.294
fosab
-0.028
si:dkey-178o16.4
0.284
rab11fip1b
-0.028
LOC101885764
0.284
uqcrc2a
-0.028
dmrt3a
0.284
sparc
-0.027
CU570976.1
0.278
tmem54a
-0.027
slc47a4
0.277
ndufa12
-0.027
onecut3b
0.273
otomp
-0.026
hoxa10b
0.270
cd63
-0.026
trpc7b
0.267
eya1
-0.026
hoxd9a
0.266
tagln2
-0.026
LOC108183311
0.253
h1fx
-0.026
hoxb10a
0.252
limch1b
-0.026
zgc:152891
0.252
gadd45ba
-0.026
XLOC-013106
0.252
si:dkey-222f2.1
-0.026
LOC108191536
0.248
id2b
-0.026
sstr2a
0.244
eef1da
-0.026
cdx4
0.238
ndrg3b
-0.026
pcgf3
0.234
tax1bp1b
-0.026
pkd2l1
0.233
FQ323156.1
-0.026