Daniocell
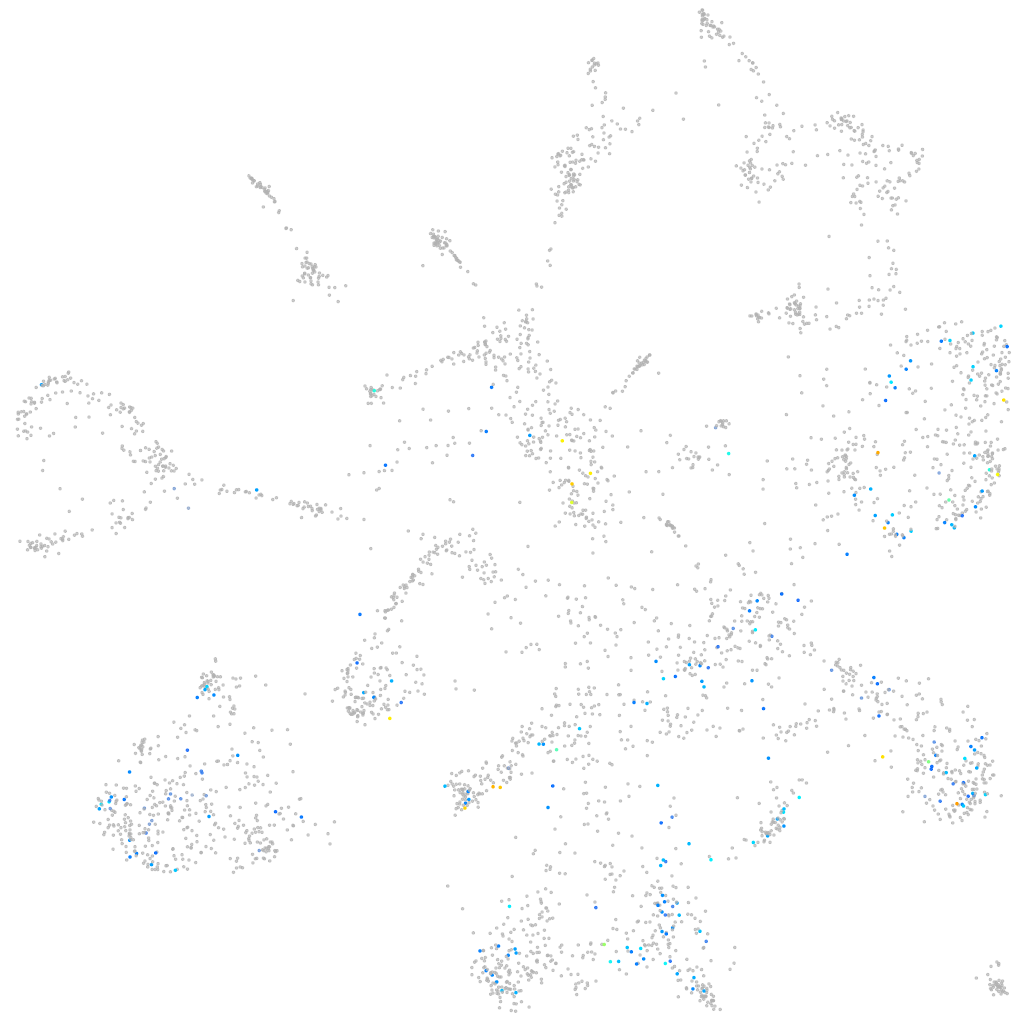
hoxa9b (mural cells / non-skeletal muscle)
homeobox A9b
ZFIN
Gene expression UMAP
Display:
Expression
Stage
Other cell groups
all cells
blastomeres
PGCs
endoderm
axial mesoderm
muscle
mural cells /
non-skeletal muscle
mesenchyme
hematopoietic /
vasculature
pronephros
neural
spinal cord / glia
eye
taste / olfactory
otic / lateral line
epidermis
periderm
fin
ionocytes / mucous
pigment cells
Expression by stage/cluster
Correlated gene expression
Positive correlation
Negative correlation
Gene
r
Gene
r
hoxa10b
0.182
gstm.3
-0.072
hoxc9a
0.164
rbpms2b
-0.068
hoxc10a
0.152
barx1
-0.068
hoxd9a
0.148
si:dkey-57k2.6
-0.066
diras1b
0.143
fbln5
-0.066
LOC101887092
0.143
c1qtnf6a
-0.065
shisal1b
0.141
junba
-0.065
LOC103909675
0.138
cdh11
-0.062
pimr60
0.138
crip1
-0.062
zgc:162060
0.138
alcama
-0.061
LOC101883465
0.137
LO018188.1
-0.059
unc119.2
0.133
prss59.2
-0.059
cfd
0.132
zgc:162939
-0.059
hoxa11b
0.132
znf385a
-0.058
XLOC-039113
0.128
bambia
-0.058
hlx1
0.127
foxc1b
-0.058
XLOC-006820
0.123
cyp1c1
-0.057
LOC101882313
0.122
rasl11a
-0.057
CR387996.1
0.120
wu:fj16a03
-0.057
si:ch211-207e19.15
0.119
zgc:162730
-0.056
hoxa9a
0.118
anxa1a
-0.056
FO681390.1
0.118
FP102018.1
-0.056
LOC100331480
0.116
rpz5
-0.054
LOC101885484
0.116
CABZ01092746.1
-0.054
hrh2b
0.116
gata5
-0.054
kctd14
0.113
fosab
-0.054
hoxa11a
0.111
efemp2a
-0.054
hoxd12a
0.110
dap1b
-0.053
CABZ01040054.1
0.110
sdc4
-0.053
CR628365.1
0.109
cyp2ad2
-0.053
LOC110439512
0.108
cox4i2
-0.053
CR391953.1
0.106
bgnb
-0.053
hoxc11a
0.106
krt18a.1
-0.053
LOC110439489
0.106
socs3a
-0.052
frzb
0.105
angptl1a
-0.052