Daniocell
tigara (pigment cells)
TP53 induced glycolysis regulatory phosphatase a
ZFIN
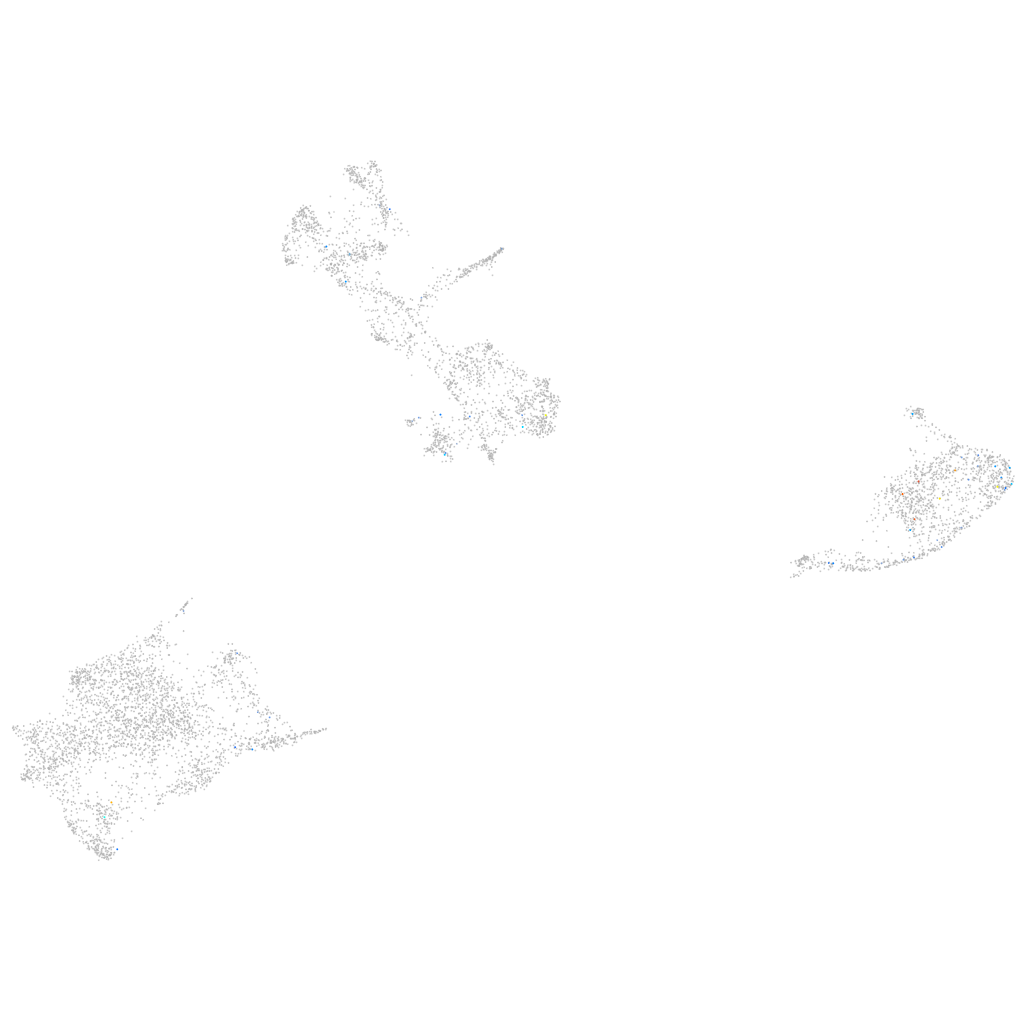
Gene expression UMAP
Display:
Expression
Stage
Other cell groups
all cells
blastomeres
PGCs
endoderm
axial mesoderm
muscle
mural cells /
non-skeletal muscle
mesenchyme
hematopoietic /
vasculature
pronephros
neural
spinal cord / glia
eye
taste / olfactory
otic / lateral line
epidermis
periderm
fin
ionocytes / mucous
pigment cells
Expression by stage/cluster
Correlated gene expression
Positive correlation
Negative correlation
Gene
r
Gene
r
si:dkey-9i23.6
0.378
paics
-0.041
LOC103911551
0.279
mdh1aa
-0.039
si:dkey-222h21.5
0.279
uraha
-0.039
gig2j
0.217
CABZ01021592.1
-0.037
si:dkey-217g21.3
0.210
si:dkey-251i10.2
-0.036
zgc:194312
0.194
glulb
-0.036
mchr2l
0.192
eef1b2
-0.031
CABZ01084382.1
0.175
phyhd1
-0.030
si:ch211-235i11.4
0.169
prdx1
-0.029
CR626886.1
0.169
atic
-0.028
CABZ01040998.1
0.168
prdx5
-0.027
zgc:113279
0.167
akr1b1
-0.026
XLOC-035578
0.164
cyb5a
-0.026
si:dkey-188i13.9
0.159
sec61g
-0.025
rapgef3
0.150
sult1st1
-0.025
DMWD
0.148
gch2
-0.025
trhra
0.147
rpl12
-0.024
XLOC-042868
0.143
ppat
-0.024
si:ch211-12e13.12
0.139
shmt1
-0.024
CR388207.1
0.138
zgc:153031
-0.022
lgi3
0.136
hbbe1.2
-0.022
si:dkey-221l4.11
0.136
acta1b
-0.022
abcc4
0.136
tmem130
-0.022
AL935126.2
0.134
rbp4l
-0.022
hephl1b
0.133
aldob
-0.022
BX950188.1
0.132
si:ch211-222l21.1
-0.022
si:dkey-40n15.1
0.128
prpsap1
-0.022
cep170b
0.127
slc2a15a
-0.021
fndc5a
0.126
si:ch211-251b21.1
-0.021
trim35-30
0.126
pfas
-0.021
AL772300.1
0.126
cox4i1
-0.020
CABZ01114105.1
0.124
rpl21
-0.020
si:dkeyp-53d3.5
0.124
TMEM19
-0.020
cldng
0.123
apoa2
-0.020
LOC101883361
0.121
oacyl
-0.020