Daniocell
tigara (eye)
TP53 induced glycolysis regulatory phosphatase a
ZFIN
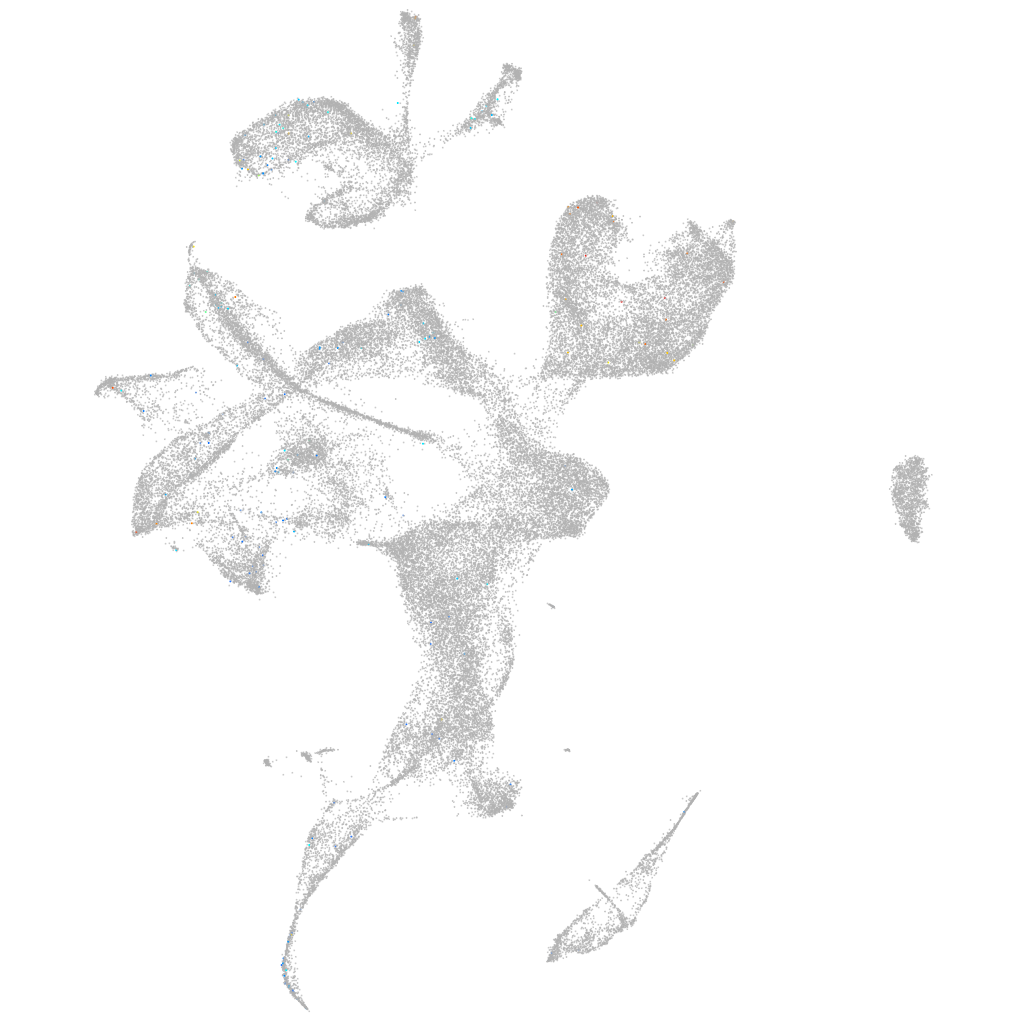
Gene expression UMAP
Display:
Expression
Stage
Other cell groups
all cells
blastomeres
PGCs
endoderm
axial mesoderm
muscle
mural cells /
non-skeletal muscle
mesenchyme
hematopoietic /
vasculature
pronephros
neural
spinal cord / glia
eye
taste / olfactory
otic / lateral line
epidermis
periderm
fin
ionocytes / mucous
pigment cells
Expression by stage/cluster
Correlated gene expression
Positive correlation
Negative correlation
Gene
r
Gene
r
si:ch211-215e19.6
0.078
si:dkey-151g10.6
-0.029
mfrp
0.070
rps23
-0.029
il17d
0.068
rplp0
-0.029
trim108
0.067
rps29
-0.028
LOC101883493
0.059
rpl10a
-0.027
LOC110438239
0.055
rps21
-0.027
CR848749.2
0.053
rpl32
-0.026
LOC110440139
0.053
rplp2l
-0.026
kbtbd13
0.053
si:ch211-222l21.1
-0.025
LOC108180121
0.051
rpl26
-0.025
CU306817.1
0.051
hmgb2a
-0.025
LOC110438467
0.051
rpl19
-0.025
CABZ01070747.1
0.050
rpl27
-0.025
si:ch211-215k15.4
0.050
rps20
-0.025
vsig10l
0.048
rpl10
-0.025
XLOC-039295
0.048
hmgb2b
-0.024
LOC101884296
0.048
rpl35
-0.024
adamtsl7
0.047
rpl13
-0.024
BX571940.1
0.046
rps25
-0.024
vsig8b
0.046
rps19
-0.023
slc26a6l
0.045
rps12
-0.023
atp2a3
0.044
rpl12
-0.023
zgc:63569
0.044
rplp1
-0.023
LOC101885328
0.044
snrpd1
-0.023
dnah6
0.043
rpl30
-0.023
BX908780.2
0.043
rps15a
-0.023
si:ch211-113d11.6
0.043
rps27a
-0.023
il23r
0.041
rps5
-0.023
CR391977.1
0.041
rpl23a
-0.023
LOC100005685
0.041
rpl22
-0.022
birc6-as2
0.041
ran
-0.022
moto
0.040
rps13
-0.022
si:ch211-171b20.3
0.040
rpsa
-0.022
ces3
0.039
snrpe
-0.022
fam149a
0.038
mcm7
-0.022