Daniocell
tigara (ionocytes / mucous-producing)
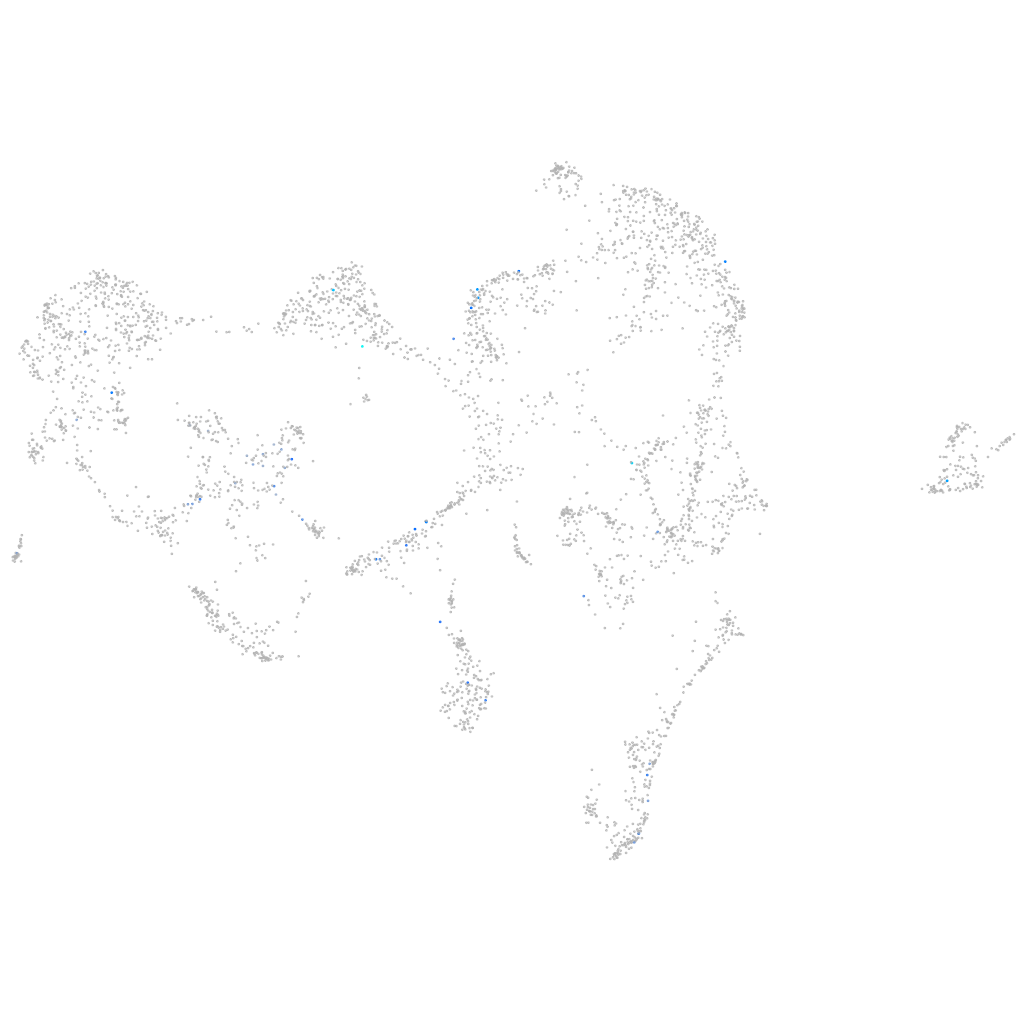
TP53 induced glycolysis regulatory phosphatase a
ZFIN
Gene expression UMAP
Display:
Expression
Stage
Other cell groups
all cells
blastomeres
PGCs
endoderm
axial mesoderm
muscle
mural cells /
non-skeletal muscle
mesenchyme
hematopoietic /
vasculature
pronephros
neural
spinal cord / glia
eye
taste / olfactory
otic / lateral line
epidermis
periderm
fin
ionocytes / mucous
pigment cells
Expression by stage/cluster
Correlated gene expression
Positive correlation
Negative correlation
Gene
r
Gene
r
si:dkey-21e2.10
0.372
cstf1
-0.043
si:dkey-21e2.14
0.370
rsl1d1
-0.042
zgc:162331
0.345
srprb
-0.041
LOC110438679
0.328
actl6a
-0.041
il13
0.326
mapre1a
-0.039
si:dkey-21e2.8
0.326
si:dkey-42i9.4
-0.038
si:ch211-67e16.3
0.321
stag2b
-0.036
si:dkey-21e2.13
0.320
zgc:174935
-0.035
LOC100148254
0.309
TSTA3 (1 of many)
-0.035
zmp:0000001323
0.305
zgc:193505
-0.035
si:ch211-236p5.2
0.302
marcksb
-0.034
trhr2
0.294
fam76b
-0.034
si:ch211-212d10.1
0.294
cx43.4
-0.034
si:ch211-186j3.6
0.293
rhebl1
-0.033
si:dkey-21e2.16
0.290
nudcd3
-0.033
XLOC-042085
0.284
cenpw
-0.033
si:dkey-21e2.15
0.278
dennd2da
-0.033
hcn4l
0.276
nudcd2
-0.033
si:dkeyp-20g2.3
0.270
ddx39aa
-0.032
ikzf1
0.267
si:dkeyp-110e4.6
-0.032
LOC110438185
0.267
mphosph8
-0.032
adcy1b
0.263
rps21
-0.032
il4
0.254
ube2e1
-0.031
si:ch1073-303d10.1
0.238
TADA1
-0.031
LOC108184002
0.228
ric8b
-0.031
pdzk1ip1
0.226
exosc9
-0.031
si:ch211-276a17.5
0.218
si:dkey-151g10.6
-0.031
alkal2b
0.208
zdhhc4
-0.031
itgb7
0.207
psmd9
-0.031
CT025909.1
0.197
tmem30b
-0.031
slc15a1b
0.196
inip
-0.030
LOC100535743
0.195
CR383676.1
-0.030
coro1a
0.195
fcf1
-0.030
g6pca.1
0.195
cops5
-0.030
elovl5
0.194
cd2bp2
-0.030