Daniocell
tigara (endoderm)
TP53 induced glycolysis regulatory phosphatase a
ZFIN
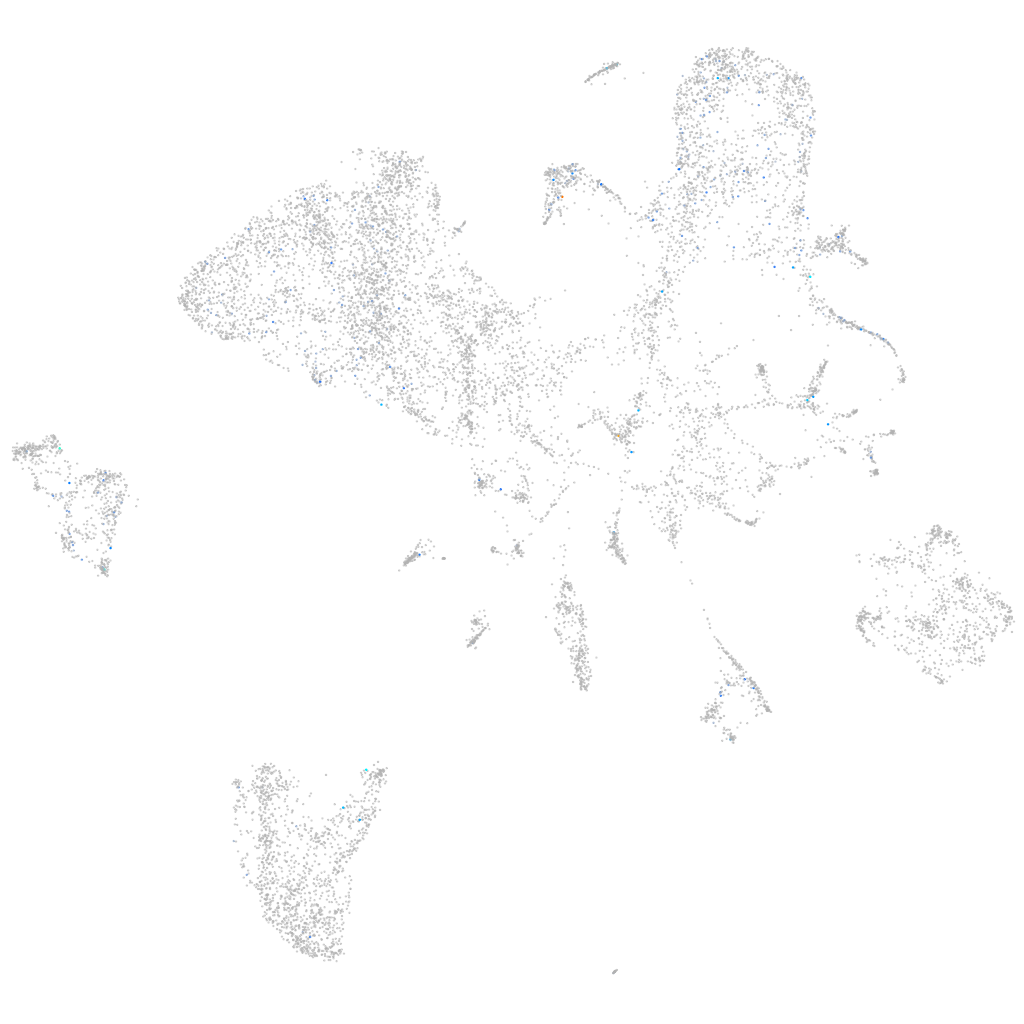
Gene expression UMAP
Display:
Expression
Stage
Other cell groups
all cells
blastomeres
PGCs
endoderm
axial mesoderm
muscle
mural cells /
non-skeletal muscle
mesenchyme
hematopoietic /
vasculature
pronephros
neural
spinal cord / glia
eye
taste / olfactory
otic / lateral line
epidermis
periderm
fin
ionocytes / mucous
pigment cells
Expression by stage/cluster
Correlated gene expression
Positive correlation
Negative correlation
Gene
r
Gene
r
LOC108180147
0.334
aqp12
-0.044
XLOC-003396
0.297
apoc1
-0.043
opn1mw2
0.242
bhmt
-0.042
cops6
0.232
cd81a
-0.041
klf6b
0.189
hspb1
-0.037
CR925803.1
0.179
cx43.4
-0.036
LOC108190593
0.178
marcksb
-0.035
klhl6
0.175
cdh6
-0.034
BX511120.1
0.174
fabp3
-0.034
XLOC-006316
0.172
si:dkey-56m19.5
-0.033
LOC101884382
0.171
odc1
-0.032
snx1b
0.166
tgif1
-0.031
rgs11
0.166
sept15
-0.031
LOC110439601
0.165
marcksl1b
-0.031
CU550702.1
0.151
amy2a
-0.030
nek10
0.139
eif4ebp3
-0.030
LOC101884286
0.138
rtn1a
-0.030
matk
0.136
prss59.1
-0.030
avpr1aa
0.134
fscn1a
-0.029
si:ch73-368j24.3
0.134
cdh2
-0.029
nfe2l1a
0.132
akap12b
-0.029
fbxl20
0.129
lrrc58a
-0.028
FO681314.1
0.128
zgc:92744
-0.028
si:ch211-241j8.2
0.124
lima1a
-0.028
FP015862.1
0.122
fep15
-0.027
LOC101884142
0.122
ela2
-0.027
nfat5b
0.118
pltp
-0.027
hrh1
0.113
nr6a1a
-0.027
LOC108182795
0.112
c6ast4
-0.027
LOC100536797
0.111
erp27
-0.027
XLOC-028807
0.110
CELA1 (1 of many)
-0.027
btbd11a
0.108
cel.1
-0.027
BX663503.1
0.107
prtfdc1
-0.027
stk39
0.105
cpa5
-0.027
LO018584.1
0.105
vox
-0.027