Daniocell
tigara (hematopoietic / vasculature)
TP53 induced glycolysis regulatory phosphatase a
ZFIN
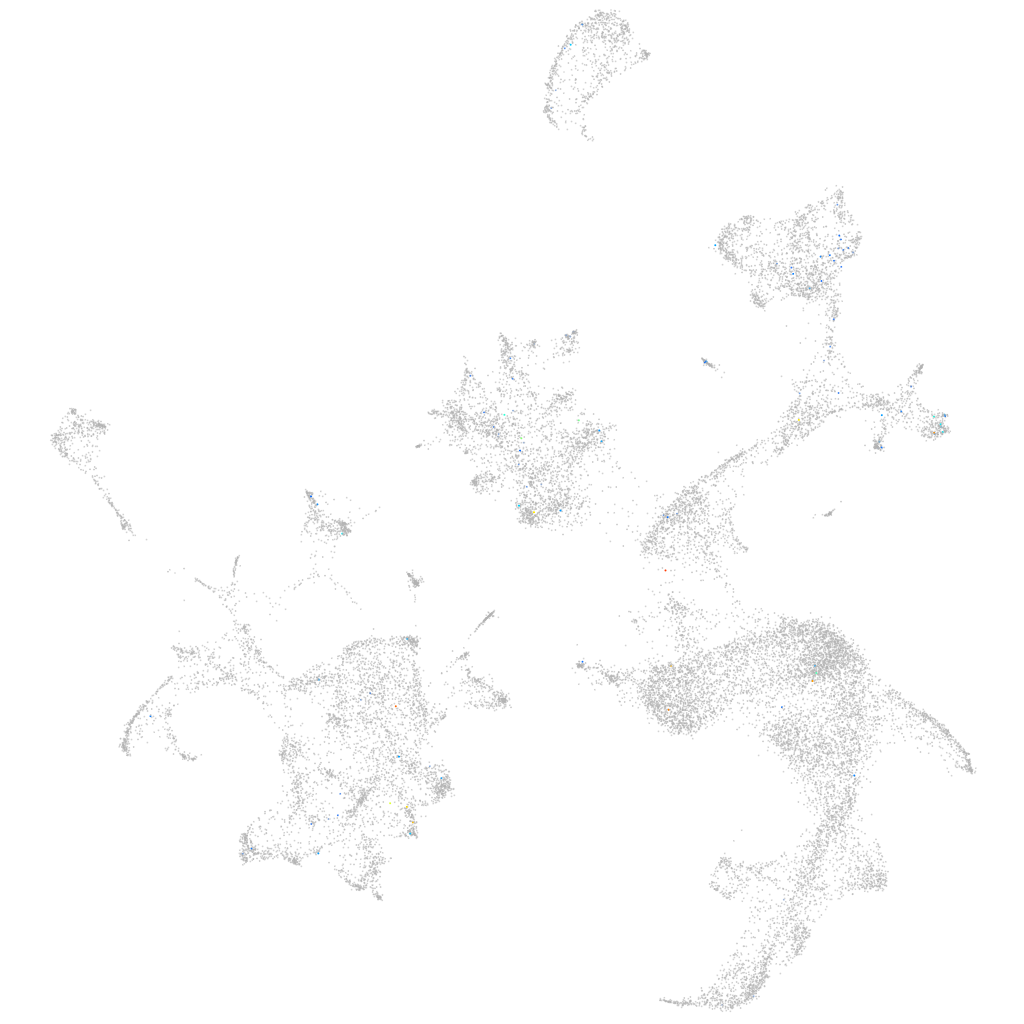
Gene expression UMAP
Display:
Expression
Stage
Other cell groups
all cells
blastomeres
PGCs
endoderm
axial mesoderm
muscle
mural cells /
non-skeletal muscle
mesenchyme
hematopoietic /
vasculature
pronephros
neural
spinal cord / glia
eye
taste / olfactory
otic / lateral line
epidermis
periderm
fin
ionocytes / mucous
pigment cells
Expression by stage/cluster
Correlated gene expression
Positive correlation
Negative correlation
Gene
r
Gene
r
si:ch211-229c8.13
0.223
ap2m1a
-0.030
LOC103910850
0.206
tspo
-0.029
rec8b
0.189
blvrb
-0.026
LOC101883107
0.173
hbbe3
-0.025
LOC101884357
0.126
znfl2a
-0.024
si:ch211-57m13.9
0.119
slc4a1a
-0.024
gfral
0.113
hbae1.3
-0.023
CR847503.2
0.110
hbae1.1
-0.023
LOC110437996
0.105
urod
-0.022
ccdc36
0.099
hbae3
-0.022
BX927363.1
0.096
tmem14ca
-0.022
slc18a3b
0.096
zgc:163057
-0.022
cpa1
0.092
mibp
-0.021
slc2a15b
0.090
hbbe1.3
-0.021
XLOC-022245
0.087
hbbe1.2
-0.021
LOC101886997
0.084
glrx5
-0.020
opn4a
0.084
tmod4
-0.020
si:ch211-236g6.1
0.084
nmt1b
-0.020
CABZ01037174.1
0.083
fam210b
-0.020
LOC100007686
0.083
zgc:56095
-0.019
rhoh
0.082
hmbsb
-0.019
or106-2
0.081
rhd
-0.019
CR318624.2
0.080
hbbe1.1
-0.018
si:ch1073-90m23.1
0.079
nt5c2l1
-0.018
si:ch73-367j5.3
0.076
tfr1a
-0.018
tradv14.0
0.075
alad
-0.018
sod3b
0.074
clgn
-0.018
zgc:92275
0.073
plac8l1
-0.017
tac4
0.073
hbae5
-0.017
tac3a
0.073
tal1
-0.017
LOC100534993
0.071
vdac2
-0.017
si:dkey-63d15.12
0.070
hdr
-0.017
CR855375.1
0.068
blf
-0.017
pfkpb
0.066
hbbe2
-0.017
XLOC-017738
0.065
hif1al2
-0.016