Daniocell
tigara (glial cells / spinal cord)
TP53 induced glycolysis regulatory phosphatase a
ZFIN
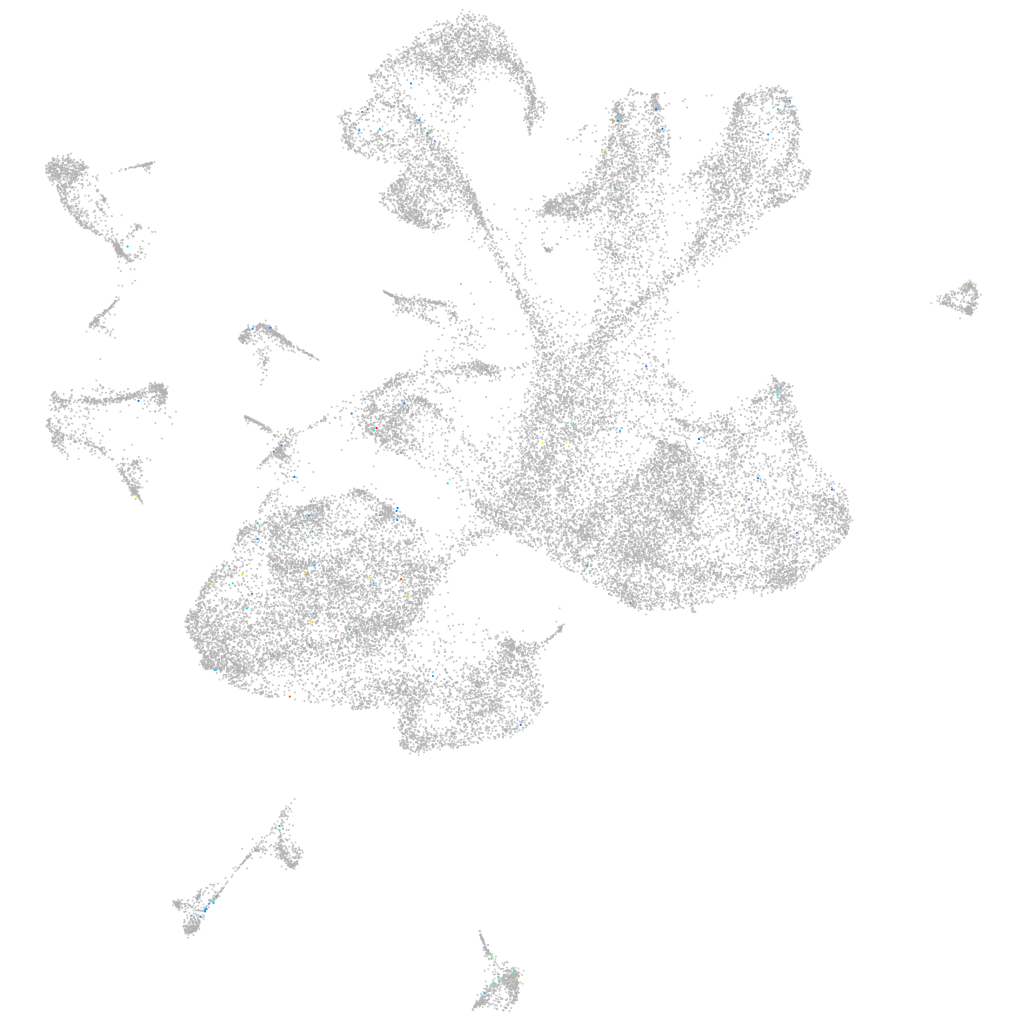
Gene expression UMAP
Display:
Expression
Stage
Other cell groups
all cells
blastomeres
PGCs
endoderm
axial mesoderm
muscle
mural cells /
non-skeletal muscle
mesenchyme
hematopoietic /
vasculature
pronephros
neural
spinal cord / glia
eye
taste / olfactory
otic / lateral line
epidermis
periderm
fin
ionocytes / mucous
pigment cells
Expression by stage/cluster
Correlated gene expression
Positive correlation
Negative correlation
Gene
r
Gene
r
si:ch211-191o15.6
0.138
si:ch211-222l21.1
-0.039
CR457444.5
0.135
rps21
-0.036
XLOC-029465
0.132
rps27.1
-0.034
LOC110437936
0.131
si:dkey-151g10.6
-0.034
or136-1
0.098
rpl8
-0.033
LOC101882326
0.096
rps19
-0.032
LOC110438497
0.090
rps23
-0.032
or128-10
0.081
rps20
-0.031
LOC101885868
0.077
si:ch73-1a9.3
-0.030
XLOC-001600
0.072
rps14
-0.030
pcdh2g3
0.071
rpl11
-0.030
LOC100535390
0.070
hmga1a
-0.030
msh5
0.069
rpl37
-0.029
adipoqb
0.068
rps5
-0.029
LOC110438399
0.068
naca
-0.029
stat1b
0.066
rps15a
-0.029
BX546503.1
0.065
hmgb2b
-0.029
amn
0.065
hmgn2
-0.028
LOC100329245
0.065
rplp1
-0.028
CABZ01085710.1
0.063
rplp0
-0.028
LOC108179642
0.062
h3f3d
-0.028
XLOC-015075
0.061
cirbpb
-0.028
pimr179
0.060
rps25
-0.027
BX649490.1
0.059
rack1
-0.027
tdo2a
0.058
khdrbs1a
-0.026
si:ch211-212c13.10
0.056
rps29
-0.026
si:dkey-11d18.4
0.056
rps9
-0.026
si:ch211-226h7.5
0.055
rps7
-0.026
hao1
0.054
rps26l
-0.026
BX547934.2
0.054
rpl13
-0.026
cx28.8
0.054
rps24
-0.026
BX465838.1
0.052
hnrnpa0l
-0.026
CU929359.1
0.052
rplp2l
-0.026
soul5
0.052
eef1a1l1
-0.026
slmapb
0.052
hsp90ab1
-0.025