Daniocell
tigara (axial mesoderm)
TP53 induced glycolysis regulatory phosphatase a
ZFIN
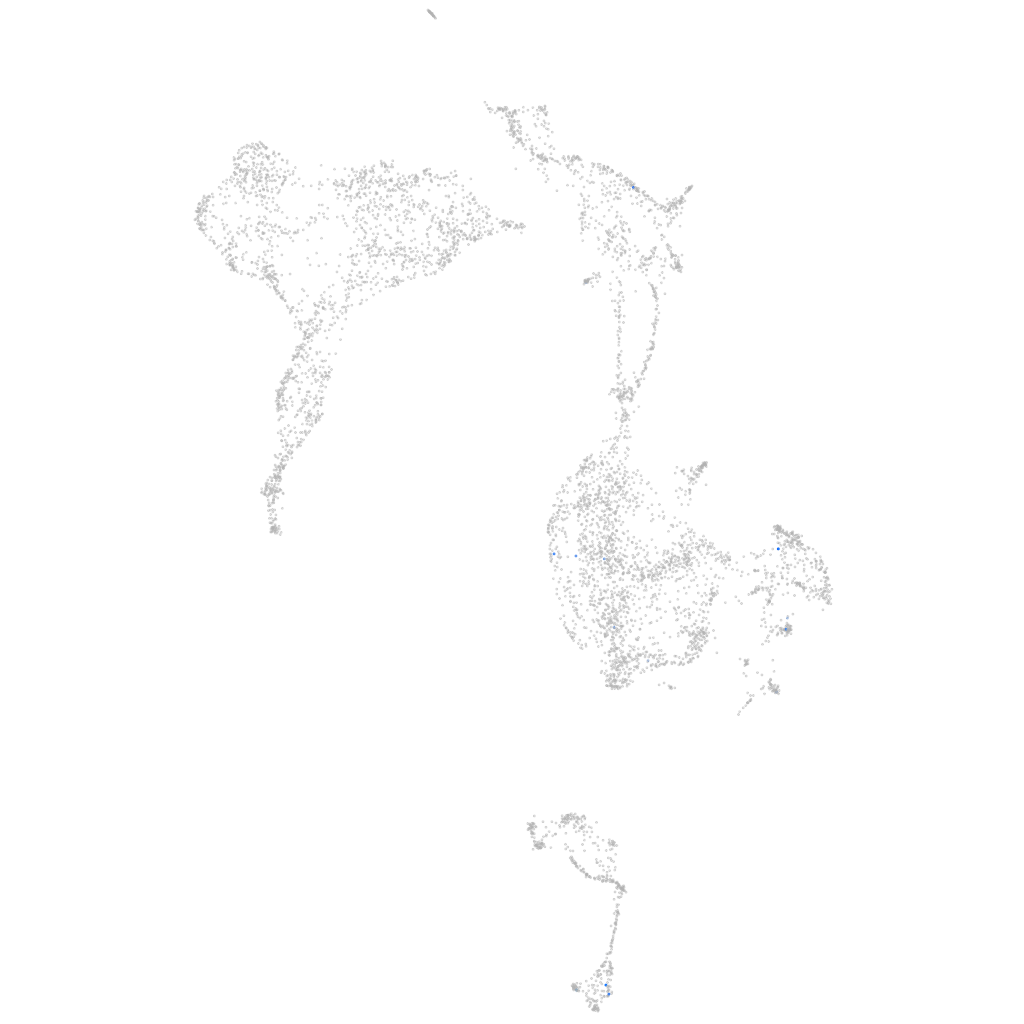
Gene expression UMAP
Display:
Expression
Stage
Other cell groups
all cells
blastomeres
PGCs
endoderm
axial mesoderm
muscle
mural cells /
non-skeletal muscle
mesenchyme
hematopoietic /
vasculature
pronephros
neural
spinal cord / glia
eye
taste / olfactory
otic / lateral line
epidermis
periderm
fin
ionocytes / mucous
pigment cells
Expression by stage/cluster
Correlated gene expression
Positive correlation
Negative correlation
Gene
r
Gene
r
BX572077.2
0.465
nhp2
-0.035
LOC110439893
0.465
NC-002333.4
-0.035
si:ch211-1f22.2
0.465
dkc1
-0.035
rasal1a
0.465
npm1a
-0.034
taar20w
0.465
nop58
-0.034
jac9
0.336
hspb1
-0.033
or111-6
0.324
hmga1a
-0.033
LOC101884869
0.314
pabpc1a
-0.033
asip1
0.306
hnrnpa1a
-0.033
LOC100333474
0.296
snu13b
-0.033
LOC108183600
0.287
top1l
-0.033
tradv15.0
0.275
ebna1bp2
-0.033
ugt2b3
0.275
ncl
-0.032
LOC101883251
0.262
si:ch73-281n10.2
-0.032
arvcfa
0.237
snrpa
-0.031
asb16
0.235
sec61b
-0.031
CABZ01118767.1
0.222
bms1
-0.031
AL928977.1
0.222
marcksb
-0.031
trpc2a
0.212
nucks1a
-0.031
BX901889.1
0.212
stm
-0.031
ngfa
0.205
hnrnpa1b
-0.030
or126-4
0.197
apex1
-0.030
LOC108180776
0.194
hnrnpa0b
-0.030
neto1l
0.193
anp32e
-0.030
si:ch211-285c6.2
0.193
ppig
-0.030
or118-2
0.184
snrnp70
-0.029
si:ch211-241f5.3
0.181
marcksl1b
-0.029
zgc:174356
0.180
rbm25b
-0.029
BX649533.1
0.176
srp19
-0.029
trpa1b
0.176
odc1
-0.029
LOC101883154
0.175
srrm1
-0.029
si:dkey-111e8.4
0.169
acin1b
-0.029
zgc:194655
0.166
ddx18
-0.029
MPP4 (1 of many)
0.164
eef1a1l1
-0.029
DMWD
0.160
hnrnpm
-0.028