Daniocell
tigara (mesenchyme)
TP53 induced glycolysis regulatory phosphatase a
ZFIN
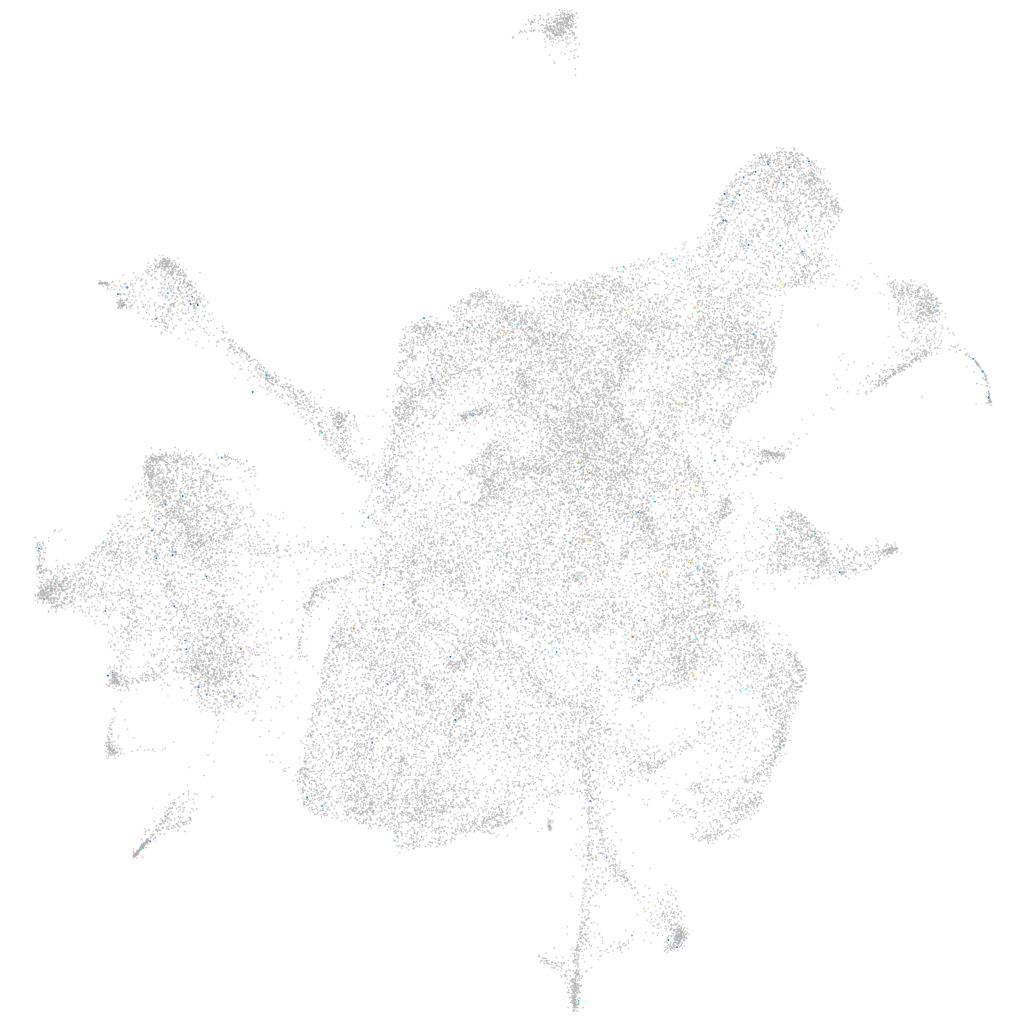
Gene expression UMAP
Display:
Expression
Stage
Other cell groups
all cells
blastomeres
PGCs
endoderm
axial mesoderm
muscle
mural cells /
non-skeletal muscle
mesenchyme
hematopoietic /
vasculature
pronephros
neural
spinal cord / glia
eye
taste / olfactory
otic / lateral line
epidermis
periderm
fin
ionocytes / mucous
pigment cells
Expression by stage/cluster
Correlated gene expression
Positive correlation
Negative correlation
Gene
r
Gene
r
si:ch211-215k15.4
0.134
rps21
-0.019
XLOC-024017
0.124
rpl23
-0.017
il26
0.100
rps2
-0.017
LOC110438429
0.097
rpl21
-0.016
ptpn22
0.089
rpl36a
-0.016
LOC101884314
0.089
marcksb
-0.015
BX901889.1
0.085
rps15
-0.015
CR847509.1
0.082
si:dkey-151g10.6
-0.014
XLOC-042165
0.079
rpl35
-0.014
XLOC-037028
0.078
rpl36
-0.014
LOC101886193
0.072
rplp1
-0.014
nrbf2a
0.069
rpl38
-0.014
CU651668.1
0.066
lhfpl2a
-0.013
CR339059.3
0.065
rps9
-0.013
aicda
0.064
zbtb16a
-0.013
XLOC-033704
0.064
hdac1
-0.013
ido1
0.063
rpl39
-0.013
XLOC-029591
0.062
CU694197.1
-0.013
crygs4
0.059
camlg
-0.013
AL831726.3
0.058
nop16
-0.013
si:dkey-105h12.2
0.052
rplp0
-0.013
gh1
0.051
bud31
-0.013
XLOC-028644
0.051
sap18
-0.013
ggt1l2.1
0.048
hnrnpaba
-0.013
krt222
0.048
rps14
-0.013
si:dkey-26i13.6
0.047
rps27.2
-0.013
XLOC-014486
0.046
rpl29
-0.012
trim35-24
0.045
rps10
-0.012
CABZ01065679.1
0.045
cbx5
-0.012
ccdc24
0.044
rps29
-0.012
BX323074.2
0.044
nop58
-0.012
LOC100332293
0.044
aebp1
-0.012
gzm3.3
0.043
snrpf
-0.012
gig2q
0.043
h2afvb
-0.012
BX901957.1
0.042
snrpd2
-0.012