Daniocell
tigara (otic / lateral line)
TP53 induced glycolysis regulatory phosphatase a
ZFIN
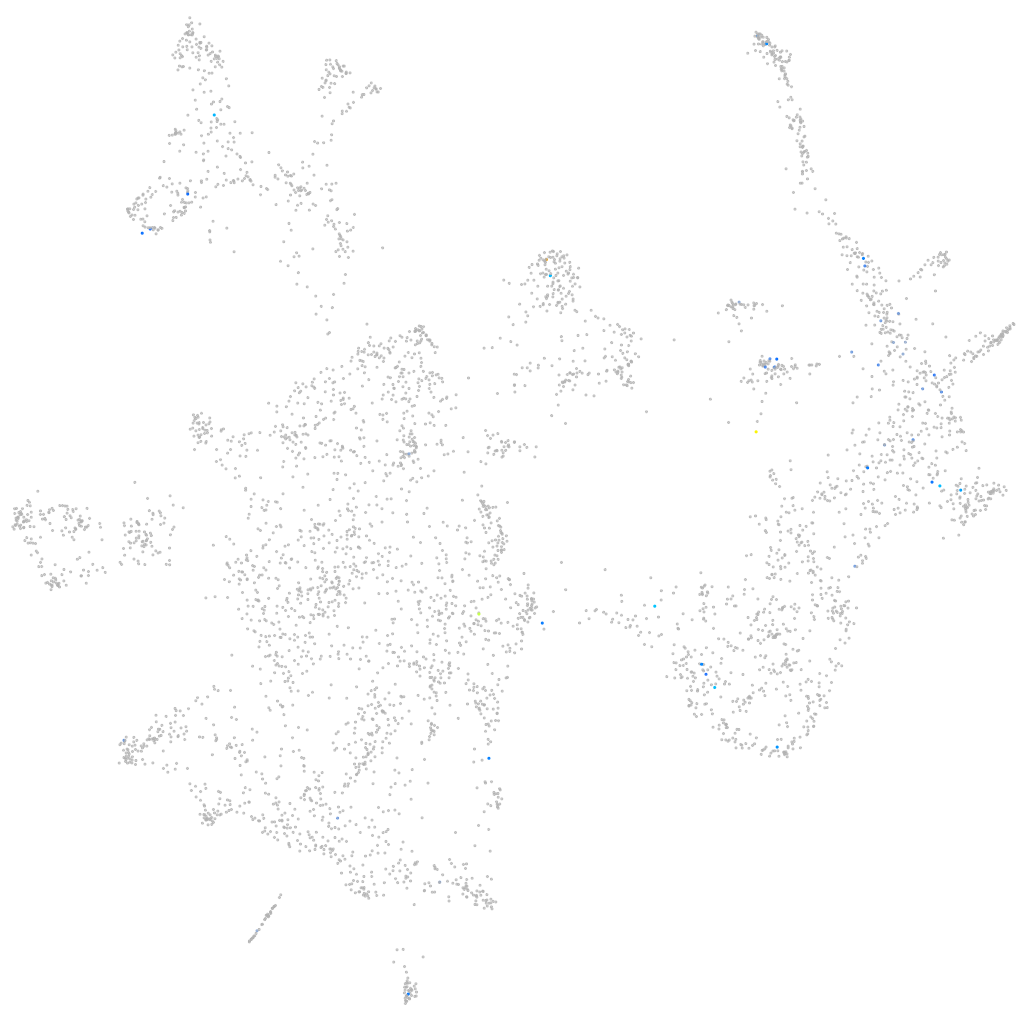
Gene expression UMAP
Display:
Expression
Stage
Other cell groups
all cells
blastomeres
PGCs
endoderm
axial mesoderm
muscle
mural cells /
non-skeletal muscle
mesenchyme
hematopoietic /
vasculature
pronephros
neural
spinal cord / glia
eye
taste / olfactory
otic / lateral line
epidermis
periderm
fin
ionocytes / mucous
pigment cells
Expression by stage/cluster
Correlated gene expression
Positive correlation
Negative correlation
Gene
r
Gene
r
slc23a1
0.412
agr2
-0.062
kiaa1549lb
0.383
h2afvb
-0.048
sult5a1
0.343
si:dkey-98f17.3
-0.048
si:ch211-241b2.5
0.340
apex1
-0.048
XLOC-032001
0.319
cldna
-0.047
CEP170B (1 of many)
0.296
cbx5
-0.047
vav3a
0.295
atrx
-0.047
CR769769.3
0.294
hmga1a
-0.046
irx4b
0.268
srsf11
-0.046
zgc:194101
0.267
rbm8a
-0.046
bdh2
0.264
fkbp3
-0.046
erbb4a
0.261
tbx2b
-0.045
si:ch211-153l6.6
0.256
syncrip
-0.045
cacna1g
0.254
psmb2
-0.045
ly6m2
0.239
h2afva
-0.044
rims4
0.233
abcf1
-0.044
XLOC-043755
0.228
acbd7
-0.043
lbx2
0.227
si:ch211-51e12.7
-0.042
tmem240a
0.223
si:ch211-133n4.4
-0.042
CR848683.2
0.219
sae1
-0.042
si:ch211-255i3.4
0.219
hmgb2b
-0.042
lbx1a
0.218
hspe1
-0.042
zgc:194908
0.218
snrpd2
-0.041
LOC108180813
0.216
supt16h
-0.041
onecut3a
0.212
supt4h1
-0.040
cbsa
0.210
hp1bp3
-0.040
LOC103910941
0.207
zbtb16a
-0.040
acsl3a
0.201
eny2
-0.040
ephb2a
0.201
boc
-0.039
LO018400.1
0.200
bricd5
-0.039
LOC103908739
0.200
ppib
-0.039
si:ch211-122l24.6
0.196
snrpg
-0.038
cadm2b
0.196
hnrnpm
-0.038
asb15a
0.190
khsrp
-0.038
LOC101882375
0.184
tnc
-0.038