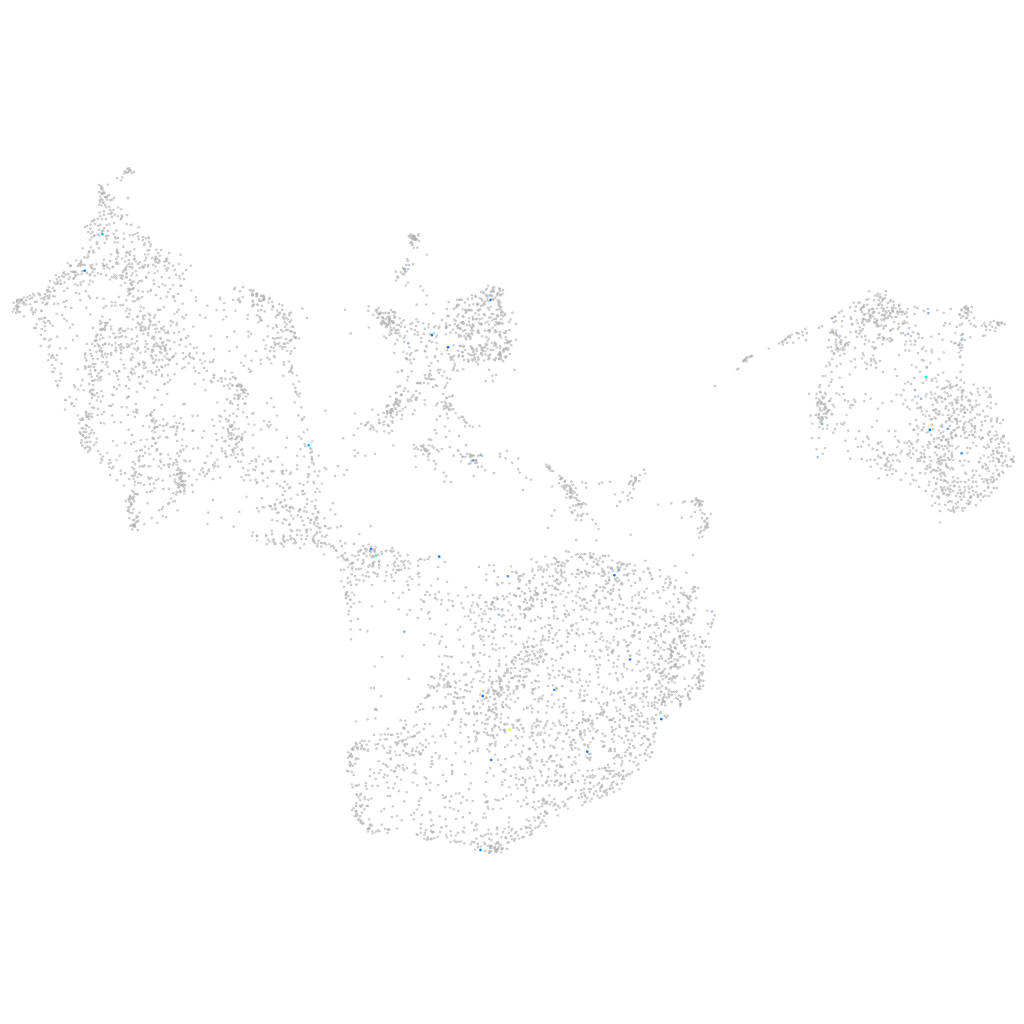
Daniocell
tigara (fin)
TP53 induced glycolysis regulatory phosphatase a
ZFIN
Gene expression UMAP
Display:
Expression
Stage
Other cell groups
all cells
blastomeres
PGCs
endoderm
axial mesoderm
muscle
mural cells /
non-skeletal muscle
mesenchyme
hematopoietic /
vasculature
pronephros
neural
spinal cord / glia
eye
taste / olfactory
otic / lateral line
epidermis
periderm
fin
ionocytes / mucous
pigment cells
Expression by stage/cluster
Correlated gene expression
Positive correlation
Negative correlation
Gene
r
Gene
r
LOC108180065
0.268
NC-002333.17
-0.033
fsip1
0.254
col5a2a
-0.031
B3GAT1
0.240
rps15a
-0.027
nkx2.5
0.216
ptenb
-0.027
cd226
0.213
rpl18a
-0.026
LOC110440177
0.195
smarce1
-0.025
mycbpap
0.188
ufm1
-0.025
sult5a1
0.185
rpl21
-0.024
si:dkey-30j10.5
0.184
zgc:114188
-0.024
CU652528.1
0.184
rps26
-0.024
slc30a1b
0.184
CU638870.1
-0.023
mir196b
0.183
si:dkey-261h17.1
-0.023
si:dkey-24c2.7
0.181
plpp3
-0.022
tlr8b
0.179
cdo1
-0.022
si:ch211-175f12.2
0.179
tmem119b
-0.022
mhc1zja
0.178
hoxb13a
-0.022
si:dkey-112a7.5
0.176
thbs4b
-0.022
XLOC-015291
0.175
znhit1
-0.021
col10a1b
0.174
tia1l
-0.021
cbln11
0.173
commd2
-0.021
cfhl3
0.171
nfyba
-0.021
si:ch211-108c6.2
0.168
rps6
-0.021
mslnb
0.164
golt1bb
-0.021
ugt5b3
0.161
pik3r2
-0.021
XLOC-032843
0.157
lamp2
-0.021
BX005153.2
0.155
mfap2
-0.020
si:dkey-206f10.1
0.154
ptk7a
-0.020
XLOC-023704
0.152
gpm6bb
-0.020
cbln18
0.151
fzd2
-0.020
cd59
0.150
pmp22a
-0.020
nfatc2b
0.149
crabp1b
-0.020
npy2rl
0.146
kdm5c
-0.020
BX000438.1
0.144
msna
-0.020
si:dkeyp-50d11.2
0.144
rpl10a
-0.020
celsr3
0.139
prdx4
-0.020