Daniocell
si:ch73-314g15.3 (epidermis)
si:ch73-314g15.3
ZFIN
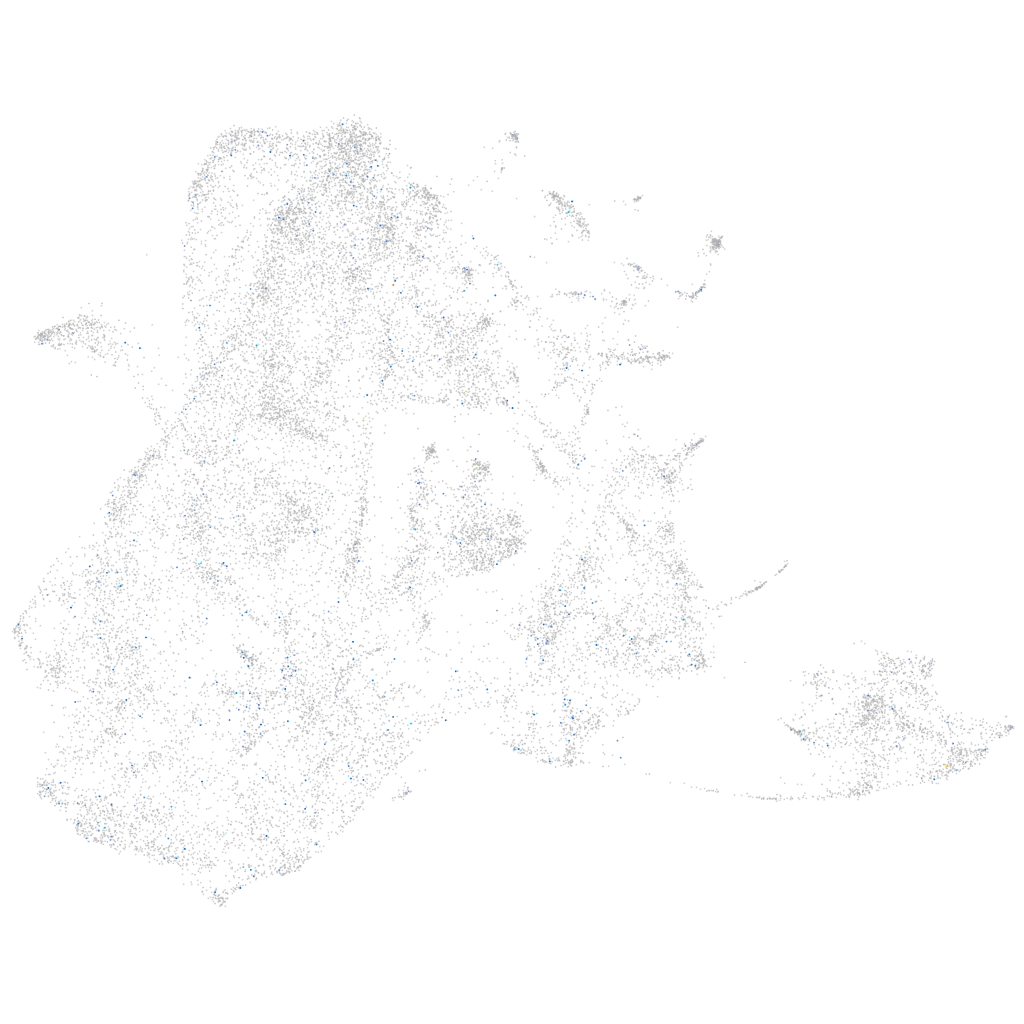
Gene expression UMAP
Display:
Expression
Stage
Other cell groups
all cells
blastomeres
PGCs
endoderm
axial mesoderm
muscle
mural cells /
non-skeletal muscle
mesenchyme
hematopoietic /
vasculature
pronephros
neural
spinal cord / glia
eye
taste / olfactory
otic / lateral line
epidermis
periderm
fin
ionocytes / mucous
pigment cells
Expression by stage/cluster
Correlated gene expression
Positive correlation
Negative correlation
Gene
r
Gene
r
chs1
0.136
hbbe1.1
-0.024
lmod2b
0.128
tmsb4x
-0.023
LOC100332535
0.114
unc93a
-0.022
si:ch73-160p18.4
0.114
hbbe1.3
-0.021
si:dkey-187j14.6
0.095
rplp2
-0.019
gabra6b
0.089
s100a10b
-0.019
LOC101884295
0.088
rpl38
-0.019
mkrn2os.2
0.086
tmsb1
-0.019
si:ch73-41e3.7
0.084
col1a1b
-0.019
LOC108183929
0.081
flna
-0.018
XLOC-032857
0.079
FO704772.2
-0.018
XLOC-009819
0.079
zgc:86896
-0.018
mtnr1ab
0.077
pfn1
-0.017
RF00151
0.071
cap1
-0.017
LOC110439563
0.070
col1a1a
-0.017
si:dkey-1h24.6
0.068
mylz3
-0.017
si:ch211-147g22.7
0.068
thy1
-0.017
otofb
0.066
ippk
-0.016
LOC110438261
0.065
crim1
-0.016
LOC101886102
0.063
ak1
-0.016
CU694317.1
0.062
zgc:113921
-0.016
opn5
0.061
CU693494.2
-0.016
si:ch211-67n3.9
0.060
mylpfb
-0.016
BX927101.1
0.059
hrasa
-0.016
BX571772.1
0.059
FAR2
-0.015
BX322661.1
0.059
strn4
-0.015
XLOC-028556
0.058
ahnak
-0.015
BX005129.3
0.058
aep1
-0.015
ccl35.2
0.058
ank3a
-0.015
XLOC-040753
0.057
rps29
-0.015
cfap43
0.056
znf384l
-0.015
XLOC-011211
0.056
c7a
-0.015
tmprss15
0.055
col28a2a
-0.015
zdhhc21.1
0.054
VIT
-0.015
LOC100538023
0.054
bmp16
-0.014