Daniocell
si:ch73-314g15.3 (taste / olfactory)
si:ch73-314g15.3
ZFIN
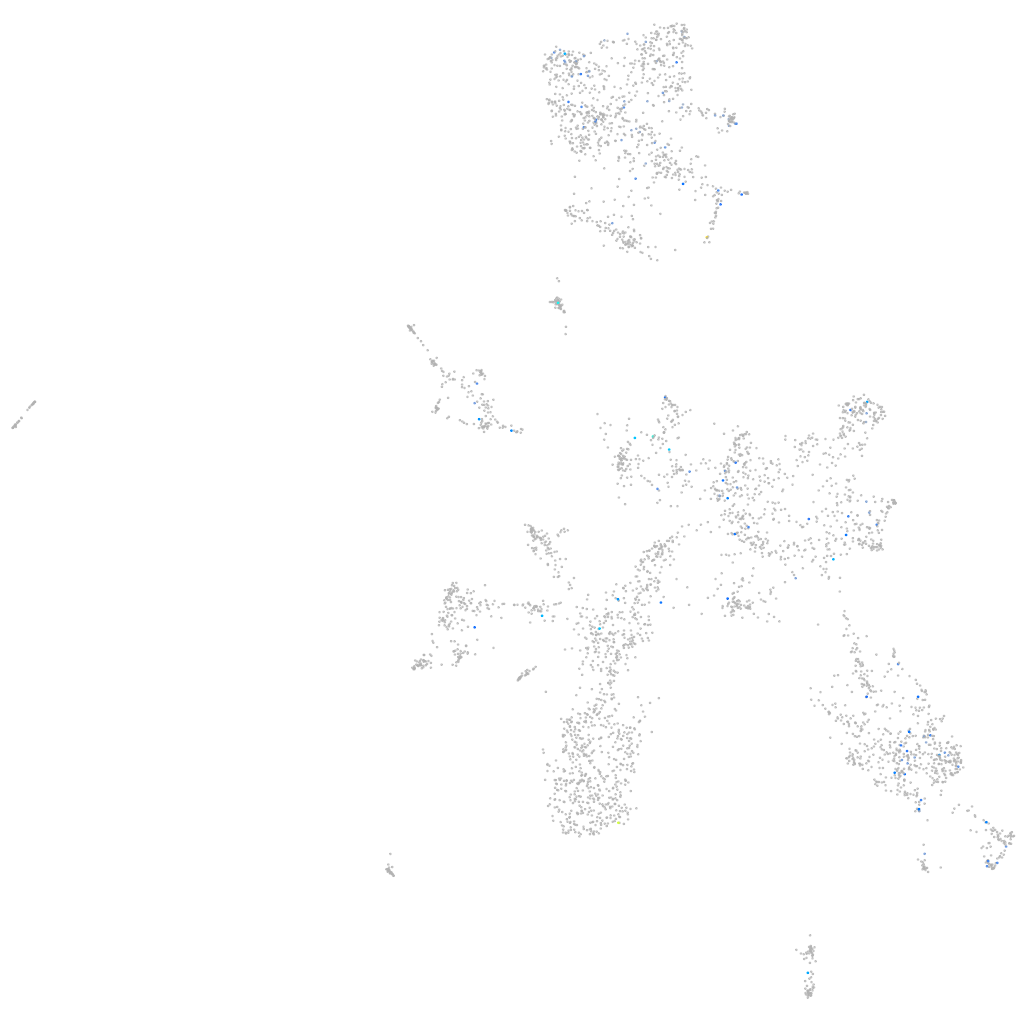
Gene expression UMAP
Display:
Expression
Stage
Other cell groups
all cells
blastomeres
PGCs
endoderm
axial mesoderm
muscle
mural cells /
non-skeletal muscle
mesenchyme
hematopoietic /
vasculature
pronephros
neural
spinal cord / glia
eye
taste / olfactory
otic / lateral line
epidermis
periderm
fin
ionocytes / mucous
pigment cells
Expression by stage/cluster
Correlated gene expression
Positive correlation
Negative correlation
Gene
r
Gene
r
cand2
0.294
atp6v1g1
-0.045
LOC100006752
0.270
sult4a1
-0.042
CU550702.1
0.231
atp6v0cb
-0.041
opn9
0.195
dctn5
-0.041
taar10b
0.181
rtn1a
-0.041
si:dkey-33m11.8
0.174
hprt1
-0.040
CR548622.1
0.173
mt-co2
-0.039
si:ch211-12h2.6
0.163
vsig8a
-0.039
XLOC-022129
0.162
si:ch211-10a23.2
-0.038
mamdc2b
0.161
myhz1.1
-0.038
XLOC-006525
0.156
stxbp1a
-0.037
cyth4b
0.153
gng3
-0.037
si:dkey-121j17.5
0.152
NC-002333.17
-0.037
CU571336.1
0.151
vamp2
-0.037
si:dkey-240e12.6
0.150
nptxrb
-0.037
LOC110438170
0.141
ckmb
-0.037
LRRTM4
0.141
NC-002333.4
-0.036
CR954285.1
0.140
pkib
-0.036
c3a.2
0.139
stmn2a
-0.036
LOC100005512
0.139
itsn2a
-0.035
CABZ01056637.1
0.139
glula
-0.035
LOC108181407
0.137
mt-co1
-0.034
zgc:171887
0.135
kif5bb
-0.034
loxl5b
0.134
s100z
-0.034
CR925879.1
0.133
mapk6
-0.034
dnai1.1
0.132
kifap3a
-0.033
sb:cb470
0.130
myl13
-0.033
irbpl
0.122
hdac9b
-0.033
si:dkeyp-68b7.12
0.121
pacsin1a
-0.033
si:dkey-245f22.3
0.119
atf5a
-0.033
BX510928.1
0.117
CR383676.1
-0.033
btbd11b
0.116
slc41a1
-0.033
LOC110437827
0.115
aplp1
-0.032
si:cabz01054394.7
0.115
bloc1s4
-0.032
opn8c
0.115
CABZ01072614.1
-0.032