Daniocell
si:ch73-314g15.3 (otic / lateral line)
si:ch73-314g15.3
ZFIN
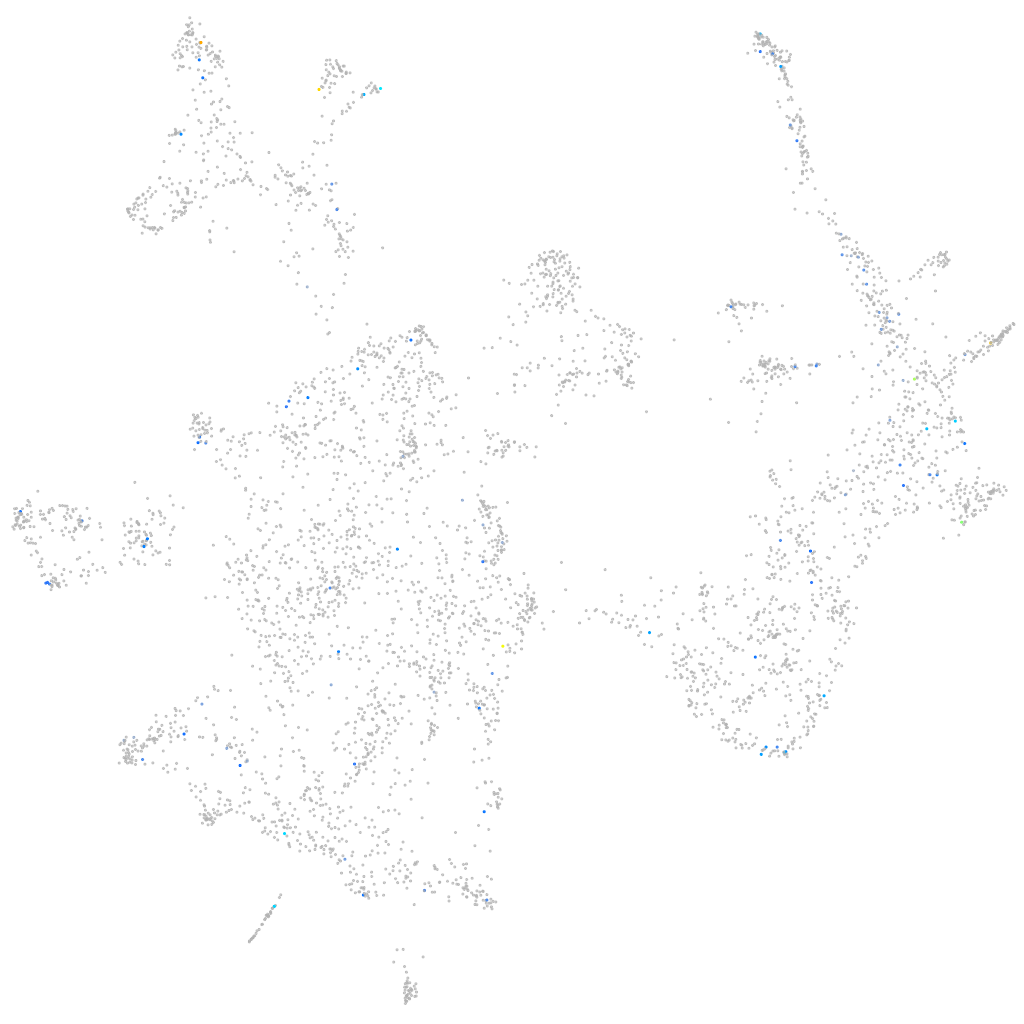
Gene expression UMAP
Display:
Expression
Stage
Other cell groups
all cells
blastomeres
PGCs
endoderm
axial mesoderm
muscle
mural cells /
non-skeletal muscle
mesenchyme
hematopoietic /
vasculature
pronephros
neural
spinal cord / glia
eye
taste / olfactory
otic / lateral line
epidermis
periderm
fin
ionocytes / mucous
pigment cells
Expression by stage/cluster
Correlated gene expression
Positive correlation
Negative correlation
Gene
r
Gene
r
LOC101883107
0.265
rpl24
-0.052
arhgef15
0.258
rps19
-0.046
LOC108183376
0.200
rps24
-0.045
LOC101883538
0.200
h2afy2
-0.043
BX942846.1
0.191
rps21
-0.041
wfs1a
0.189
rps7
-0.040
AL590150.1
0.187
fam168a
-0.040
irgf4
0.186
si:dkey-16l2.17
-0.039
LOC110438348
0.185
rpl5b
-0.039
BX571945.1
0.179
rps11
-0.038
si:ch73-344o19.1
0.166
rpl35a
-0.037
zp3.2
0.166
hmga1a
-0.036
b4galnt3a
0.164
prmt1
-0.035
AL953886.1
0.161
stm
-0.035
pgpep1l
0.157
rybpb
-0.035
si:dkey-220f10.4
0.152
ilf3b
-0.035
si:ch211-250n8.1
0.146
top1l
-0.034
LOC108179656
0.142
cct7
-0.034
si:ch73-106g13.1
0.141
ranbp1
-0.034
zmp:0000000545
0.141
pbx3b
-0.034
CR926463.1
0.138
crebzf
-0.034
LOC100007966
0.136
rpl18
-0.034
LOC110438498
0.134
rpl30
-0.033
BX569779.1
0.129
rpl23
-0.033
cnga1a
0.129
ephb3
-0.033
LOC110439519
0.126
drg1
-0.033
abca4b
0.125
rps14
-0.033
CABZ01078767.1
0.124
rps20
-0.033
glsl
0.123
hsp90ab1
-0.033
cnih3
0.123
myh10
-0.033
shc2
0.121
rpl3
-0.032
LOC101882713
0.119
hmgb3a
-0.032
h2afy
0.118
ppiaa
-0.032
si:dkey-77f5.14
0.118
irf2bpl
-0.032
XLOC-014378
0.118
sox10
-0.032