Daniocell
si:ch73-314g15.3 (mesenchyme)
si:ch73-314g15.3
ZFIN
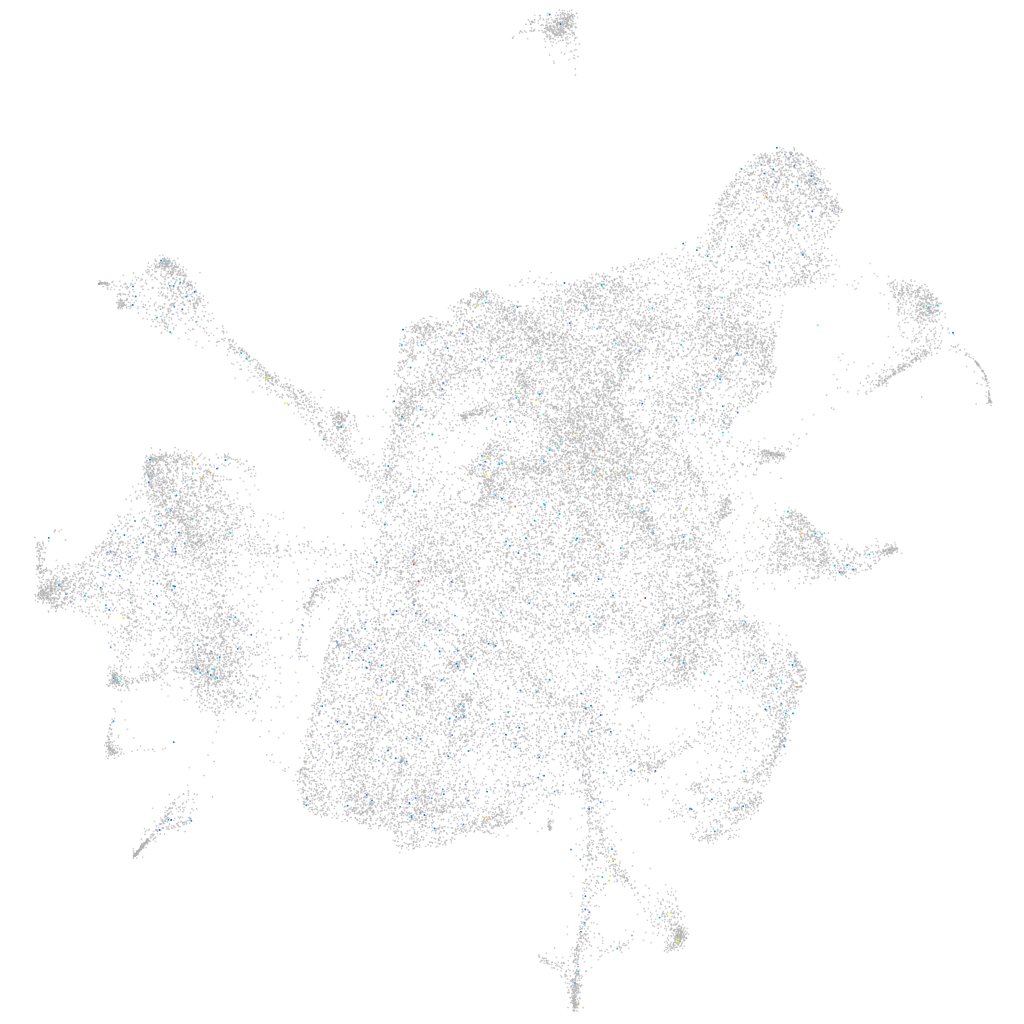
Gene expression UMAP
Display:
Expression
Stage
Other cell groups
all cells
blastomeres
PGCs
endoderm
axial mesoderm
muscle
mural cells /
non-skeletal muscle
mesenchyme
hematopoietic /
vasculature
pronephros
neural
spinal cord / glia
eye
taste / olfactory
otic / lateral line
epidermis
periderm
fin
ionocytes / mucous
pigment cells
Expression by stage/cluster
Correlated gene expression
Positive correlation
Negative correlation
Gene
r
Gene
r
LOC108181455
0.126
rpl39
-0.017
RF01233
0.090
rps21
-0.017
LOC100535518
0.082
col9a1a
-0.015
LOC110439128
0.078
col9a2
-0.015
LOC110440141
0.078
rps26
-0.015
si:ch211-8c17.3
0.077
mir199-3
-0.014
LOC108182660
0.076
cnmd
-0.014
LOC110439949
0.064
luzp1
-0.014
LOC108183614
0.064
rpl38
-0.014
fbn2a
0.060
matn4
-0.014
LOC795962
0.059
scube1
-0.014
BX537110.1
0.057
col2a1b
-0.014
si:dkey-85k15.6
0.055
hbae3
-0.013
slc24a1
0.054
rpl37
-0.013
zgc:195356
0.052
rargb
-0.013
cacng3a
0.052
sim2
-0.013
XLOC-021944
0.049
cdh11
-0.013
LOC110440051
0.048
sfrp2
-0.013
vtg4
0.047
rpl36
-0.013
nptx2b
0.047
col11a2
-0.012
LOC101887017
0.047
rps2
-0.012
cysltr1
0.045
col2a1a
-0.012
LOC103909991
0.045
barx1
-0.012
sstr3
0.044
agbl5
-0.012
mir375-2
0.044
foxl1
-0.012
si:ch211-198e20.10
0.044
opn1sw1
-0.012
LOC101885037
0.043
rpl14
-0.012
LOC101883959
0.043
rps29
-0.012
trim35-31
0.042
xirp2a
-0.011
LOC103908836
0.041
npr2
-0.011
LOC108190811
0.040
pappa2
-0.011
LOC110440125
0.040
tnni2b.2
-0.011
si:dkeyp-82b4.6
0.040
ela2l
-0.011
znf1095
0.039
ugt1b5
-0.011
BX569783.1
0.039
ephb2b
-0.011