Daniocell
si:ch73-314g15.3 (axial mesoderm)
si:ch73-314g15.3
ZFIN
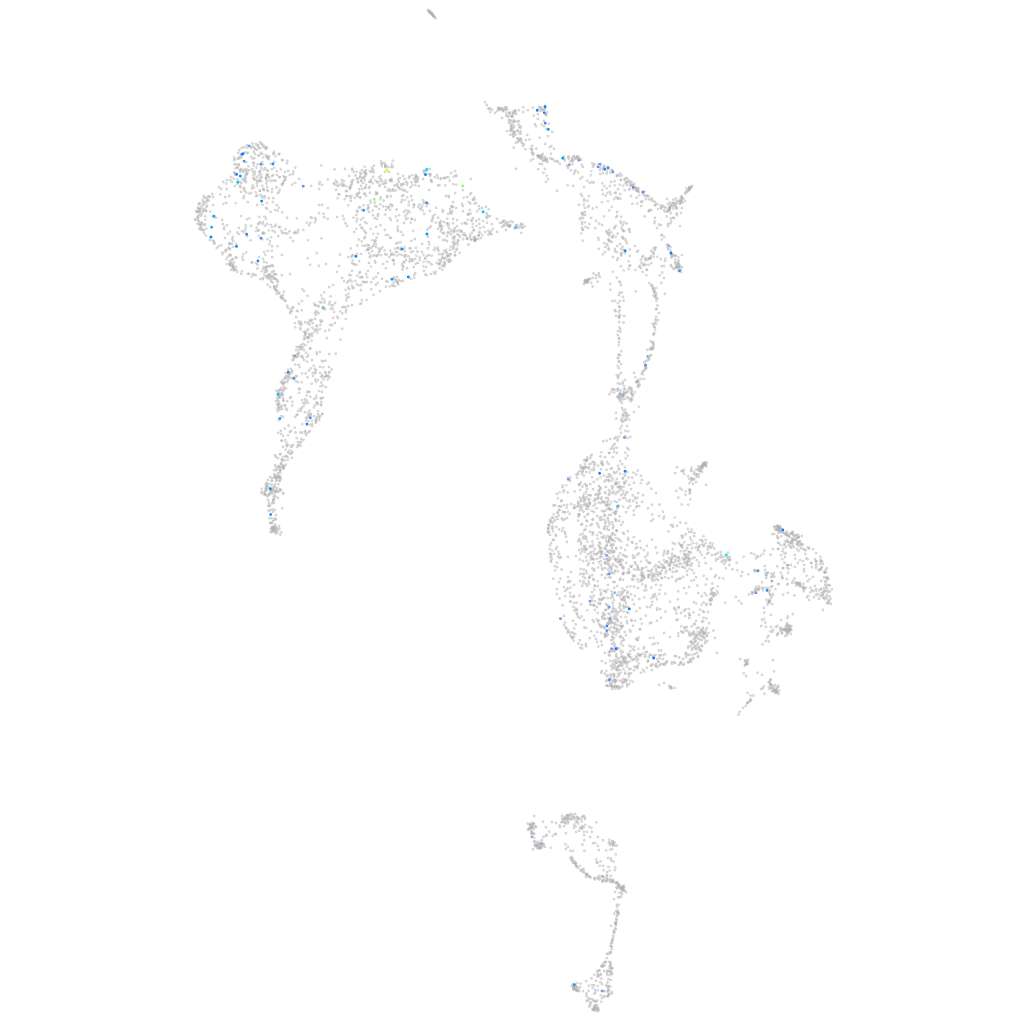
Gene expression UMAP
Display:
Expression
Stage
Other cell groups
all cells
blastomeres
PGCs
endoderm
axial mesoderm
muscle
mural cells /
non-skeletal muscle
mesenchyme
hematopoietic /
vasculature
pronephros
neural
spinal cord / glia
eye
taste / olfactory
otic / lateral line
epidermis
periderm
fin
ionocytes / mucous
pigment cells
Expression by stage/cluster
Correlated gene expression
Positive correlation
Negative correlation
Gene
r
Gene
r
LOC108181101
0.247
rpl37
-0.044
ppp1r42
0.187
zgc:158463
-0.043
dnai2b
0.165
zgc:114188
-0.043
BX511093.1
0.165
rps10
-0.042
CABZ01055306.1
0.164
si:ch73-23l24.1
-0.042
RF00553
0.153
col9a2
-0.041
LOC100536890
0.152
zgc:113232
-0.041
hhla2b.2
0.151
epyc
-0.041
LOC101883985
0.149
col2a1a
-0.041
BX649434.2
0.147
col9a1b
-0.040
WDR63
0.144
zmp:0000000760
-0.039
XLOC-001683
0.143
col9a3
-0.038
BX908395.1
0.141
col11a2
-0.038
ghrhra
0.139
krt8
-0.037
LOC103909568
0.126
NC-002333.17
-0.037
XLOC-025146
0.126
col11a1a
-0.037
LO018508.1
0.125
sparc
-0.036
BX571794.2
0.124
matn4
-0.035
ift81
0.122
CABZ01072614.1
-0.035
ttll3
0.122
rps17
-0.035
ptgir
0.121
CR383676.1
-0.035
rpz6
0.120
rpl14
-0.035
c15h3orf80
0.120
rnf44
-0.035
NABP2
0.118
pvalb1
-0.035
si:ch211-271d10.2
0.115
rpl35a
-0.034
XLOC-010030
0.114
golim4b
-0.033
efcab2
0.113
ucmab
-0.033
LOC103910897
0.111
chadla
-0.033
CR846087.3
0.110
matn3a
-0.033
si:dkey-223p19.2
0.109
cmn
-0.033
gpr135
0.109
si:dkey-118j18.2
-0.033
cass4
0.108
cnmd
-0.032
XLOC-009967
0.108
cyt1l
-0.032
tex9
0.104
krt18a.1
-0.032
wnt5a
0.104
susd5
-0.031