Daniocell
si:ch73-314g15.3 (eye)
si:ch73-314g15.3
ZFIN
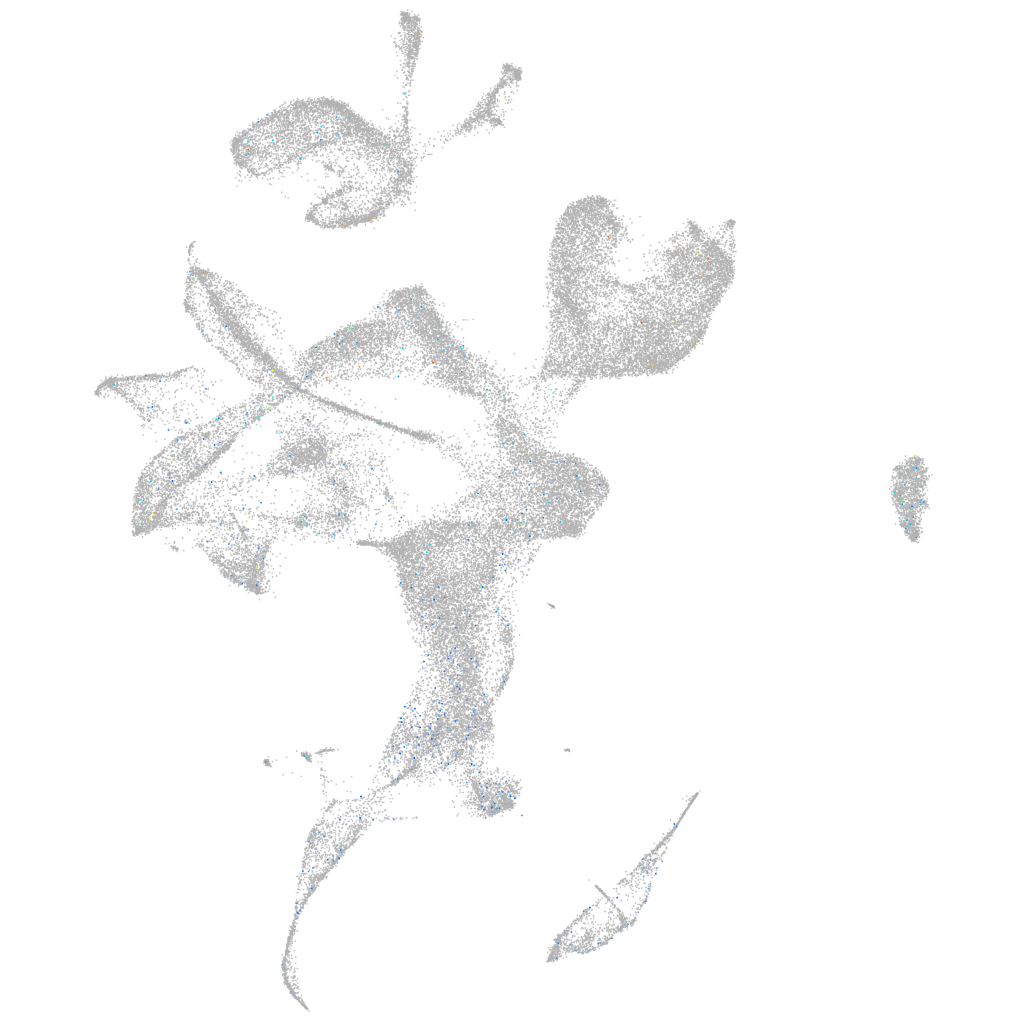
Gene expression UMAP
Display:
Expression
Stage
Other cell groups
all cells
blastomeres
PGCs
endoderm
axial mesoderm
muscle
mural cells /
non-skeletal muscle
mesenchyme
hematopoietic /
vasculature
pronephros
neural
spinal cord / glia
eye
taste / olfactory
otic / lateral line
epidermis
periderm
fin
ionocytes / mucous
pigment cells
Expression by stage/cluster
Correlated gene expression
Positive correlation
Negative correlation
Gene
r
Gene
r
taar16b
0.091
gpm6aa
-0.033
AL935126.1
0.077
ptmaa
-0.031
CU694255.2
0.074
ptmab
-0.029
gcnt4b
0.072
scrt2
-0.027
or121-1
0.068
marcksl1a
-0.027
LOC103909649
0.063
gpm6ab
-0.026
XLOC-031097
0.061
marcksl1b
-0.025
si:ch1073-204b8.1
0.058
CR383676.1
-0.024
adcy3b
0.054
ndrg4
-0.024
LOC110437984
0.053
hmgb1a
-0.023
zgc:158417
0.053
rorb
-0.023
CABZ01023255.1
0.052
nova2
-0.023
XLOC-038902
0.051
rtn1a
-0.023
rnf135
0.050
zfhx4
-0.021
valopa
0.047
stmn1b
-0.021
LOC101885686
0.047
bcl2l10
-0.021
si:dkeyp-27c8.1
0.046
hbbe1.3
-0.021
LOC797799
0.046
hbae3
-0.020
CABZ01071903.1
0.044
chd4a
-0.020
LOC101882642
0.043
btg1
-0.020
CR381673.2
0.042
tmsb4x
-0.020
c1qb
0.042
epb41a
-0.020
si:dkey-110c1.10
0.041
pcbp3
-0.020
LOC110438435
0.041
hmgn6
-0.019
BX120005.1
0.041
zc4h2
-0.019
LOC103910615
0.040
tubb5
-0.019
nop56
0.039
gng13b
-0.018
kcnq4
0.039
neurod4
-0.018
si:ch211-196f2.6
0.037
vsx1
-0.018
dkc1
0.037
elovl4a
-0.018
npm1a
0.037
hbae1.1
-0.018
grxcr2
0.037
dscaml1
-0.018
c3a.3
0.036
ubc
-0.018
pth1ra
0.036
fam107b
-0.017
pprc1
0.036
si:ch73-1a9.3
-0.017