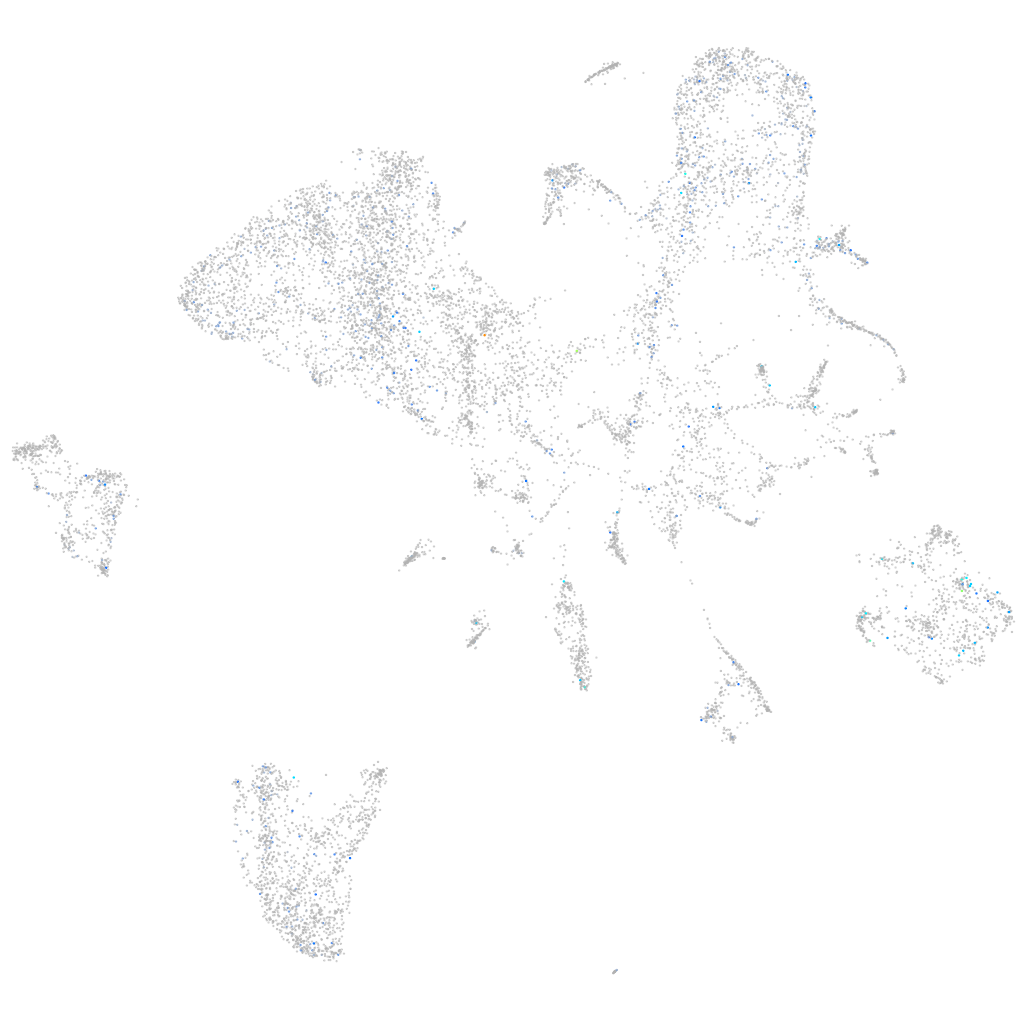
Daniocell
si:ch73-314g15.3 (endoderm)
si:ch73-314g15.3
ZFIN
Gene expression UMAP
Display:
Expression
Stage
Other cell groups
all cells
blastomeres
PGCs
endoderm
axial mesoderm
muscle
mural cells /
non-skeletal muscle
mesenchyme
hematopoietic /
vasculature
pronephros
neural
spinal cord / glia
eye
taste / olfactory
otic / lateral line
epidermis
periderm
fin
ionocytes / mucous
pigment cells
Expression by stage/cluster
Correlated gene expression
Positive correlation
Negative correlation
Gene
r
Gene
r
CU929054.1
0.145
actc1b
-0.035
CU855694.1
0.133
pvalb2
-0.028
znf1140
0.129
ak1
-0.027
zgc:165518
0.126
nme2b.2
-0.027
CR381540.3
0.125
ckmb
-0.027
dand5
0.120
rpl37
-0.026
dcc
0.120
id4
-0.026
FP101875.2
0.116
cyt1
-0.026
CR356233.2
0.115
soga1
-0.025
si:dkey-149m13.5
0.114
tpma
-0.025
CR450687.1
0.113
dap1b
-0.023
BX908780.1
0.112
LOC100537384
-0.023
AL953841.2
0.112
dzip1
-0.023
ggact.2
0.109
ephb3
-0.023
LOC101882492.1
0.109
rps10
-0.023
LOC110440064
0.107
zgc:158463
-0.022
AL935044.4
0.107
atp6v0cb
-0.022
si:dkey-183c6.7
0.106
rnf44
-0.022
gpr184
0.106
ppdpfb
-0.022
HTR7
0.105
aff4
-0.022
LOC110438926
0.104
fabp3
-0.022
cart2
0.104
mylz3
-0.022
hrh2a
0.102
zgc:136461
-0.022
gria4b
0.101
akap17a
-0.022
LOC108180112
0.100
cyt1l
-0.021
LOC108184022
0.098
myhz2
-0.021
XLOC-021306
0.097
calm1b
-0.021
LOC108190390
0.095
marcksl1a
-0.021
LOC110439505
0.095
si:ch211-195b11.3
-0.021
LOC101883443
0.094
LOC108179036
-0.021
LOC100536312
0.094
si:ch211-107p11.3
-0.021
si:ch211-110e21.3
0.093
dnajc5aa
-0.021
CT573139.1
0.093
LOC110439372
-0.021
CR626874.1
0.088
sycn.2
-0.021
LOC101884081
0.085
ret
-0.021