Daniocell
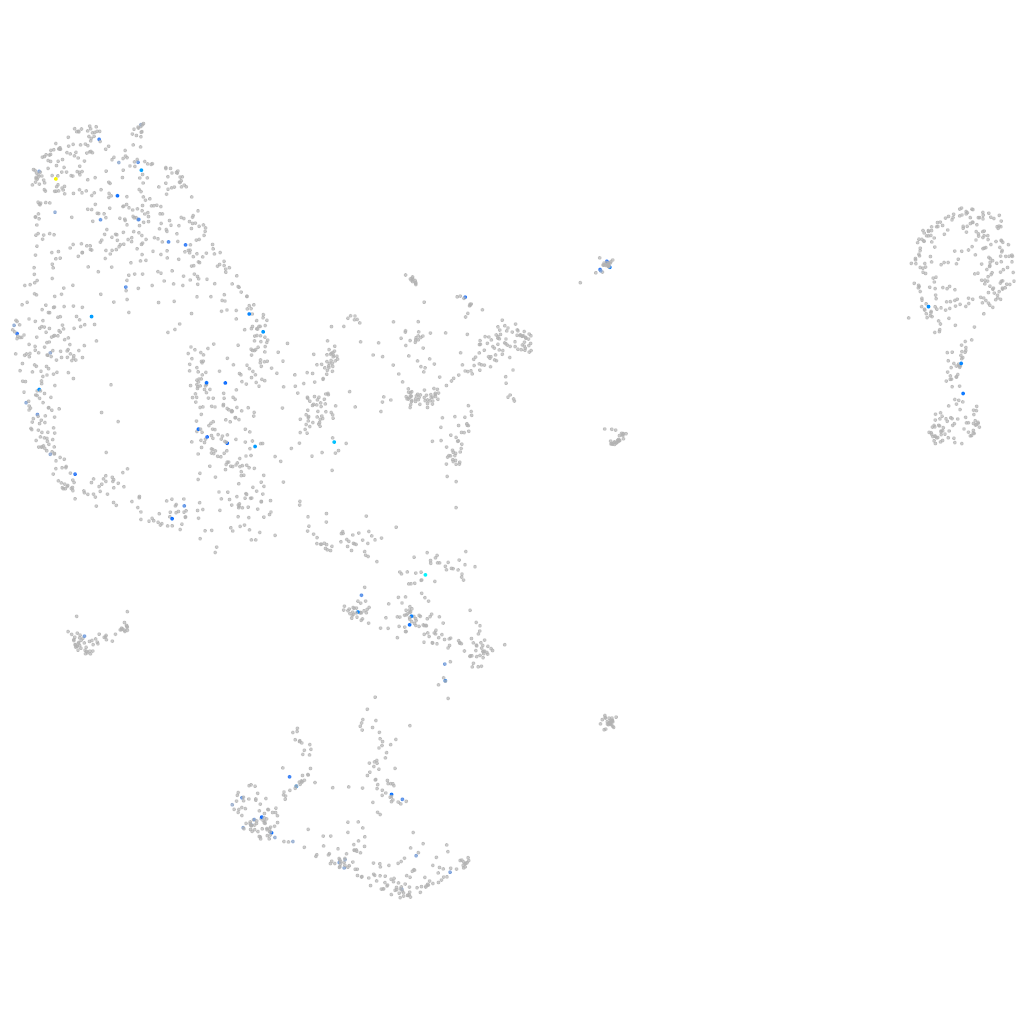
si:ch73-314g15.3 (pronephros)
si:ch73-314g15.3
ZFIN
Gene expression UMAP
Display:
Expression
Stage
Other cell groups
all cells
blastomeres
PGCs
endoderm
axial mesoderm
muscle
mural cells /
non-skeletal muscle
mesenchyme
hematopoietic /
vasculature
pronephros
neural
spinal cord / glia
eye
taste / olfactory
otic / lateral line
epidermis
periderm
fin
ionocytes / mucous
pigment cells
Expression by stage/cluster
Correlated gene expression
Positive correlation
Negative correlation
Gene
r
Gene
r
si:ch73-7i4.1
0.277
marcksl1b
-0.063
BX908386.3
0.269
syncrip
-0.057
znf1178
0.205
ptp4a1
-0.055
LOC101884966
0.203
si:ch73-1a9.3
-0.053
zdhhc16b
0.198
cyt1
-0.052
znf1066
0.197
marcksl1a
-0.049
BX927335.2
0.189
si:ch211-288g17.3
-0.049
si:dkey-265e15.5
0.189
wdr46
-0.048
si:dkey-78k11.4
0.189
ewsr1a
-0.047
BX005129.2
0.189
gpatch8
-0.047
LOC562053
0.187
rad21a
-0.047
slc8b1
0.185
ube2e2
-0.046
XLOC-026774
0.184
cxcl12a
-0.046
si:dkeyp-3f10.16
0.181
si:ch73-281n10.2
-0.046
pdzrn3a
0.178
p4hb
-0.046
si:ch211-278p9.1
0.170
lsm12b
-0.045
CR383680.1
0.166
polr1e
-0.043
SCCPDH
0.166
anp32b
-0.043
UST
0.166
si:ch211-271b14.1
-0.042
zgc:163121
0.162
mapre2
-0.042
LOC103909465
0.162
gabpa
-0.042
nab1a
0.160
wu:fi46h04
-0.042
AL954327.1
0.157
sept15
-0.042
BX248128.1
0.157
vox
-0.042
CT990567.2
0.157
cxcl12b
-0.042
LOC101884619
0.157
LOC103910438
-0.041
si:dkeyp-94g1.1
0.155
lmnb2
-0.041
LOC101883985
0.153
hbae3
-0.041
taar14h
0.153
hdac1
-0.041
rln
0.153
marcksa
-0.041
BX601648.1
0.152
tmsb1
-0.041
abcb11a
0.151
meaf6
-0.040
XLOC-012390
0.149
ppp1r7
-0.040
tmem123
0.148
hbae1.3
-0.039
CU179702.2
0.147
alg6
-0.039