Daniocell
si:ch73-314g15.3 (hematopoietic / vasculature)
si:ch73-314g15.3
ZFIN
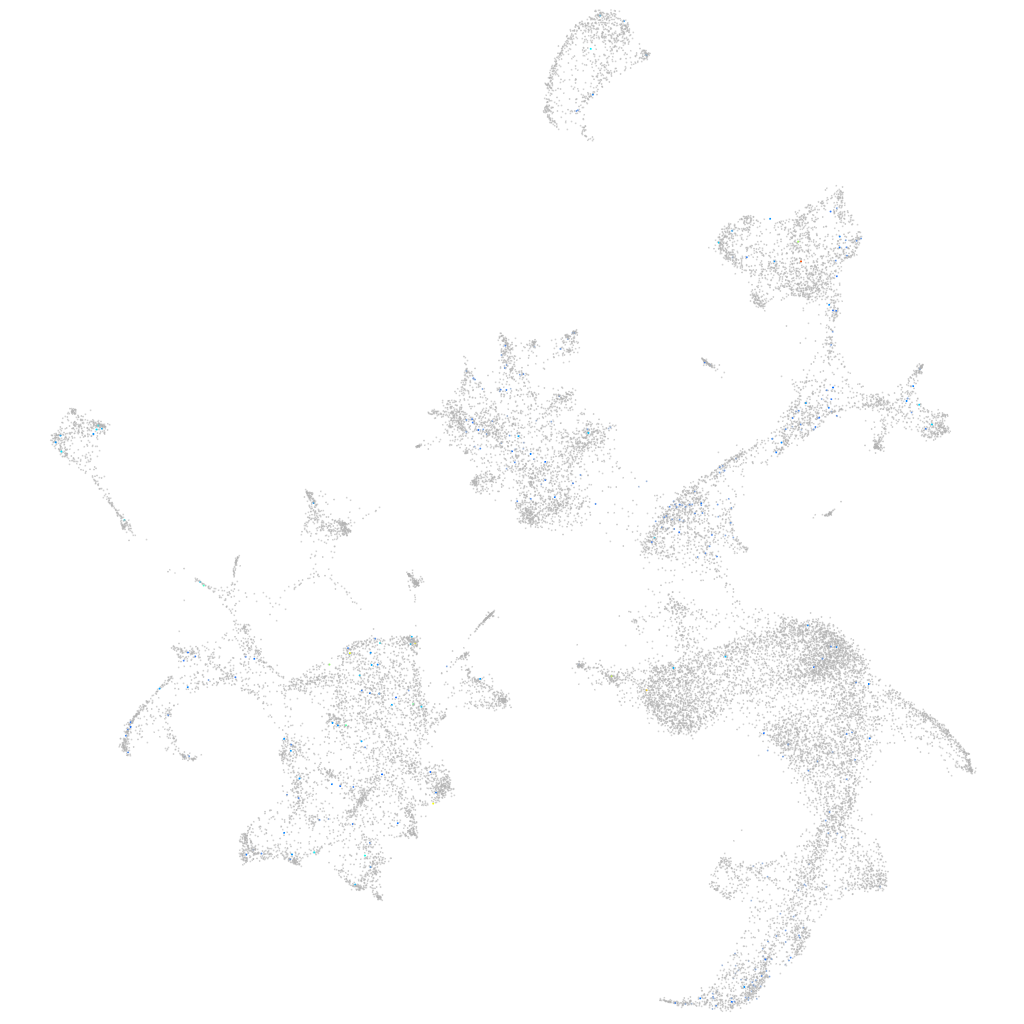
Gene expression UMAP
Display:
Expression
Stage
Other cell groups
all cells
blastomeres
PGCs
endoderm
axial mesoderm
muscle
mural cells /
non-skeletal muscle
mesenchyme
hematopoietic /
vasculature
pronephros
neural
spinal cord / glia
eye
taste / olfactory
otic / lateral line
epidermis
periderm
fin
ionocytes / mucous
pigment cells
Expression by stage/cluster
Correlated gene expression
Positive correlation
Negative correlation
Gene
r
Gene
r
BX572627.1
0.155
hbae3
-0.043
GPR68
0.141
hbbe1.3
-0.043
CR628395.1
0.108
creg1
-0.041
CR388378.1
0.102
si:ch211-250g4.3
-0.041
BX537137.2
0.100
hbbe1.2
-0.039
zmp:0000001132
0.099
hbbe2
-0.039
LOC110439893
0.098
cahz
-0.038
CABZ01043506.1
0.092
hbbe1.1
-0.038
LOC108180091
0.089
hbae1.3
-0.038
LOC100331417
0.083
hbae1.1
-0.036
BX901974.3
0.081
si:ch211-207c6.2
-0.035
LOC101885801
0.078
nt5c2l1
-0.032
CR388413.1
0.074
plac8l1
-0.030
BX324188.1
0.073
alas2
-0.030
BX005443.1
0.073
hemgn
-0.028
BX571712.1
0.073
tmod4
-0.027
XLOC-017135
0.070
eef2l2
-0.027
si:dkeyp-80d11.10
0.069
si:dkey-240n22.3
-0.026
XLOC-022666
0.069
tspo
-0.026
XLOC-006273
0.067
LOC108183423
-0.025
LOC103908832
0.067
slc4a1a
-0.025
BX323880.1
0.064
zgc:163057
-0.024
BX649388.2
0.063
tbcelb
-0.023
tas1r2.1
0.063
fth1a
-0.022
tcp1
0.062
LO017835.1
-0.022
nos2a
0.062
bnip3lb
-0.021
emb
0.061
hbae5
-0.021
si:ch211-119c20.2
0.061
slc29a1b
-0.021
XLOC-029386
0.060
fbxo32
-0.021
srrd
0.060
LOC108179634
-0.021
si:dkey-199f5.7
0.060
blvrb
-0.021
pax3b
0.060
BX950188.1
-0.020
CR925719.1
0.059
gpx1a
-0.020
BX936305.2
0.059
mylpfa
-0.020
snrpe
0.059
pvalb1
-0.020