Daniocell
si:ch73-314g15.3 (glial cells / spinal cord)
si:ch73-314g15.3
ZFIN
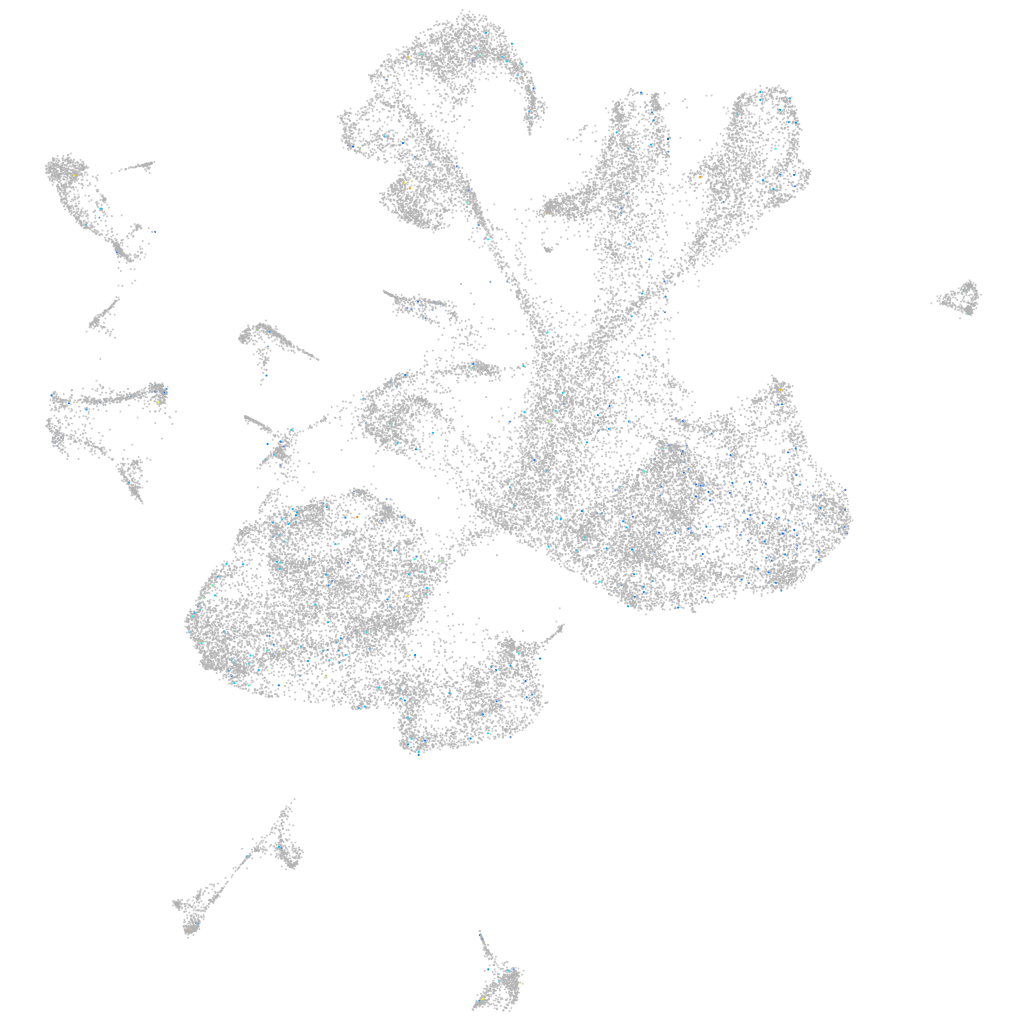
Gene expression UMAP
Display:
Expression
Stage
Other cell groups
all cells
blastomeres
PGCs
endoderm
axial mesoderm
muscle
mural cells /
non-skeletal muscle
mesenchyme
hematopoietic /
vasculature
pronephros
neural
spinal cord / glia
eye
taste / olfactory
otic / lateral line
epidermis
periderm
fin
ionocytes / mucous
pigment cells
Expression by stage/cluster
Correlated gene expression
Positive correlation
Negative correlation
Gene
r
Gene
r
LOC110439493
0.091
si:ch73-1a9.3
-0.021
CR352310.1
0.085
ptmab
-0.017
LOC101885065
0.084
hmgn2
-0.017
BX890544.1
0.080
si:ch211-222l21.1
-0.016
zgc:158257
0.068
smc1al
-0.016
LOC110439931
0.066
NC-002333.17
-0.015
LOC110439976
0.063
mt-co1
-0.015
xcr1b.3
0.062
myt1b
-0.015
dusp3b
0.062
zmiz1a
-0.015
XLOC-036755
0.058
NC-002333.4
-0.014
cldnj
0.057
hoxb8a
-0.014
asb14a
0.056
elavl3
-0.014
or126-2
0.053
elavl4
-0.014
or137-9
0.051
gpr85
-0.014
zgc:194242
0.050
nsg2
-0.014
si:dkey-1c7.1
0.049
hmga1a
-0.013
CABZ01079192.1
0.049
zfhx3
-0.013
si:dkeyp-75b4.8
0.049
rps29
-0.013
LOC101883894
0.048
stx1b
-0.013
tnni2a.3
0.047
gse1
-0.013
adh8a
0.047
fam102bb
-0.013
LOC101882845
0.046
rbms3
-0.013
LOC100006542
0.045
myt1a
-0.013
or133-7
0.045
tmie
-0.012
LOC103911081
0.045
gabrb4
-0.012
AL929171.1
0.044
gpr61
-0.012
CR339059.4
0.044
LOC100537384
-0.012
LOC108192086
0.043
arhgap35a
-0.012
si:dkey-192k22.2
0.043
slit3
-0.012
CR513785.1
0.042
bod1
-0.012
si:dkey-26i13.5
0.042
rem2
-0.012
XLOC-015256
0.041
rplp2
-0.012
nlrp15
0.040
gfra3
-0.012
LOC103910348
0.039
si:dkey-175m17.7
-0.012
pimr135
0.039
actc1b
-0.012