Daniocell
lactb2 (muscle)
"lactamase, beta 2"
ZFIN
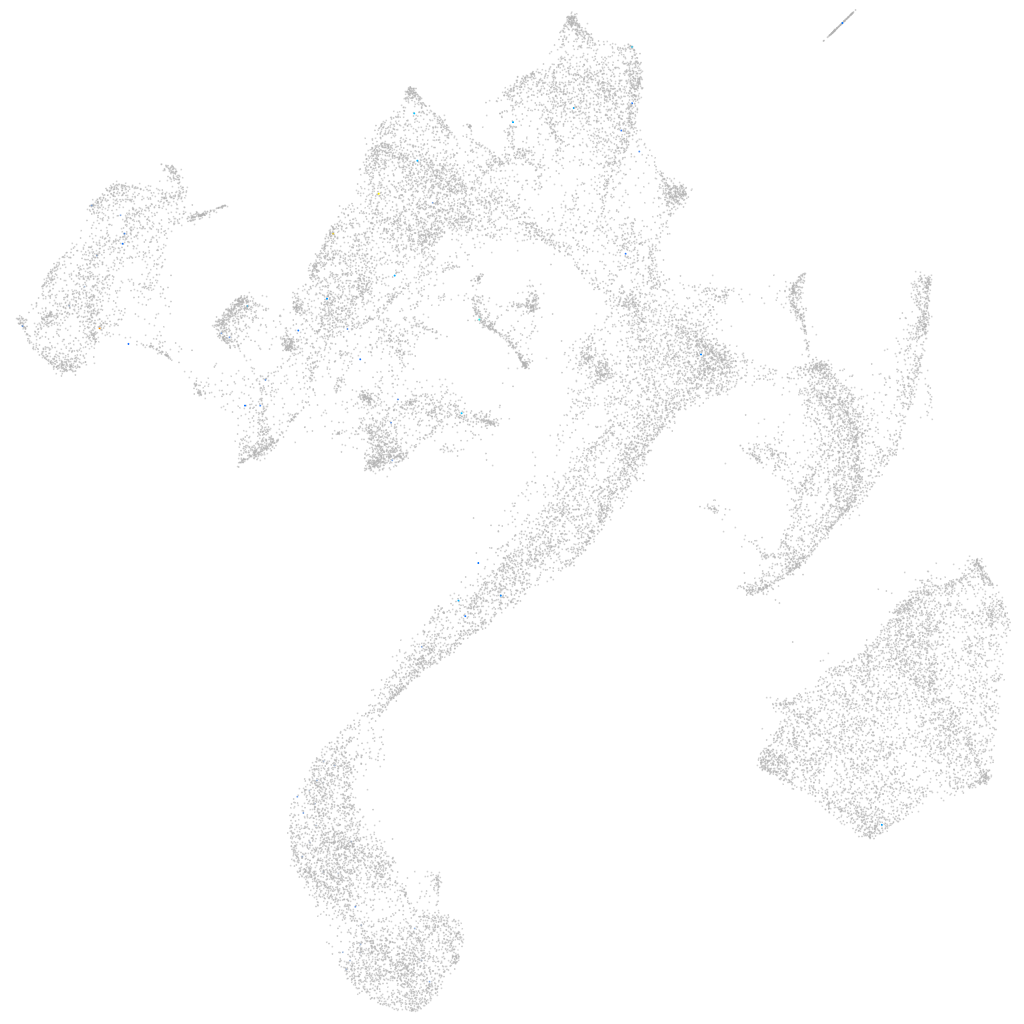
Gene expression UMAP
Display:
Expression
Stage
Other cell groups
all cells
blastomeres
PGCs
endoderm
axial mesoderm
muscle
mural cells /
non-skeletal muscle
mesenchyme
hematopoietic /
vasculature
pronephros
neural
spinal cord / glia
eye
taste / olfactory
otic / lateral line
epidermis
periderm
fin
ionocytes / mucous
pigment cells
Expression by stage/cluster
Correlated gene expression
Positive correlation
Negative correlation
Gene
r
Gene
r
si:busm1-104n07.3
0.160
eif4bb
-0.023
grxcr1a.1
0.147
snrpd1
-0.023
CR450686.1
0.134
snu13b
-0.022
ftr26
0.134
cbx3a
-0.022
XLOC-034223
0.127
srsf1a
-0.022
si:dkey-23k10.2
0.127
bms1
-0.022
tnfsf11
0.114
hmgn6
-0.022
tbx4
0.110
hnrnpaba
-0.021
XLOC-030902
0.107
polr2eb
-0.021
XLOC-027918
0.102
apoc1
-0.021
LOC103910818
0.093
seta
-0.021
GPR139
0.088
si:ch73-281n10.2
-0.021
LO017852.1
0.088
tma7
-0.021
LOC110438004
0.087
khdrbs1a
-0.020
epob
0.086
prmt1
-0.020
ccl19b
0.082
snrpd2
-0.020
si:dkey-31f5.8
0.080
BX927258.1
-0.020
laptm5
0.077
syncrip
-0.020
cd247l
0.076
fbl
-0.020
si:cabz01071909.2
0.072
erh
-0.020
zgc:92275
0.071
hmga1a
-0.020
LOC110438283
0.068
smc1al
-0.020
XLOC-019150
0.067
eif4h
-0.019
igfbp1b
0.066
marcksb
-0.019
si:dkey-82i20.1
0.064
npm1a
-0.019
arr3b
0.063
rbm4.3
-0.019
scrn2
0.062
gar1
-0.019
zbtb38
0.061
cx43.4
-0.019
tnni3k
0.061
dkc1
-0.019
si:dkey-102c8.3
0.060
ube2e1
-0.019
LOC100148254
0.057
si:ch73-308l14.2
-0.019
LOC108183538
0.057
nop56
-0.018
si:busm1-194e12.8
0.057
snrpf
-0.018
zgc:171310
0.056
nucks1a
-0.018
prkcg
0.056
snrpb2
-0.018