Daniocell
lactb2 (endoderm)
"lactamase, beta 2"
ZFIN
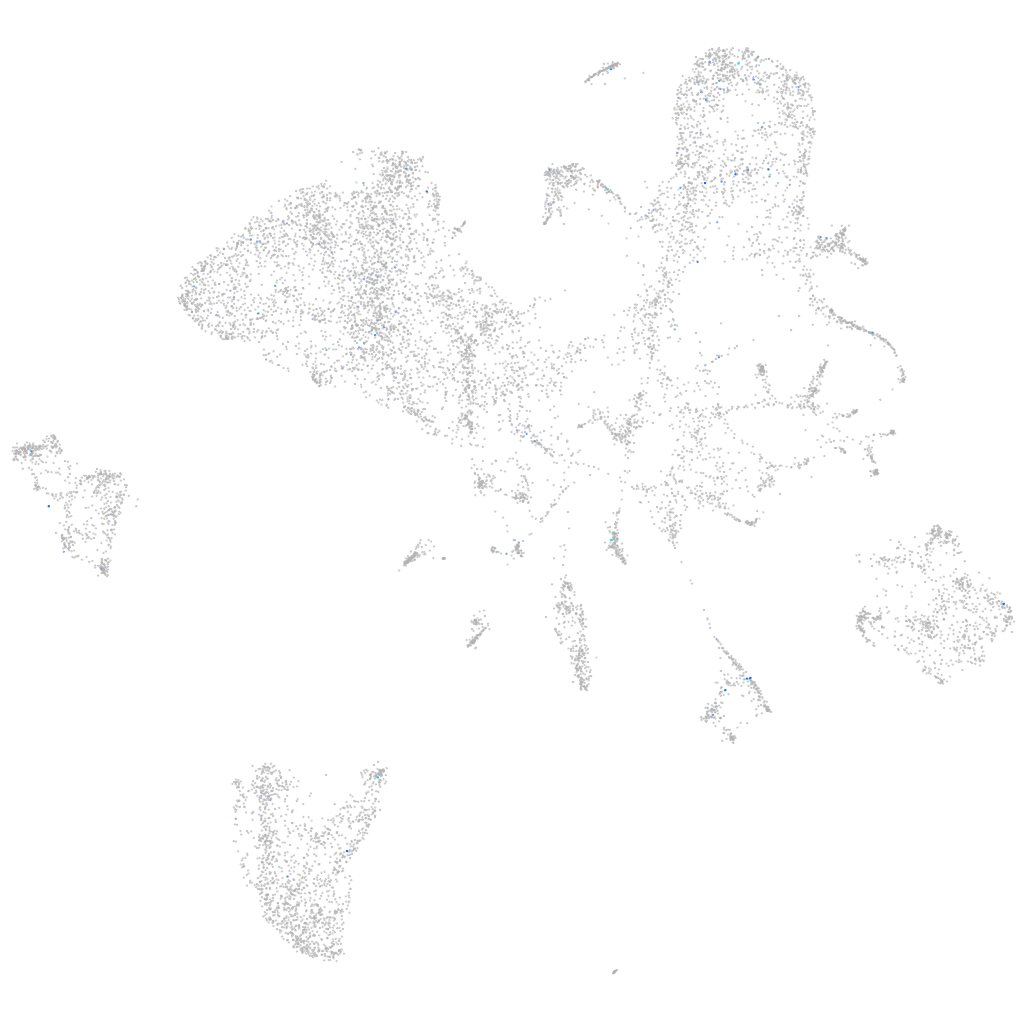
Gene expression UMAP
Display:
Expression
Stage
Other cell groups
all cells
blastomeres
PGCs
endoderm
axial mesoderm
muscle
mural cells /
non-skeletal muscle
mesenchyme
hematopoietic /
vasculature
pronephros
neural
spinal cord / glia
eye
taste / olfactory
otic / lateral line
epidermis
periderm
fin
ionocytes / mucous
pigment cells
Expression by stage/cluster
Correlated gene expression
Positive correlation
Negative correlation
Gene
r
Gene
r
LOC103910040
0.277
marcksl1b
-0.027
espnla
0.252
apoc1
-0.024
LOC110439787
0.169
hspb1
-0.023
si:ch211-284e13.12
0.168
apoeb
-0.023
si:ch211-114l13.12
0.165
tmeff1b
-0.023
XLOC-039113
0.161
si:ch211-137a8.4
-0.023
BX908799.1
0.153
lima1a
-0.021
FO681393.1
0.153
cdh6
-0.020
LOC110439419
0.145
sfrp1a
-0.020
kcna6a
0.137
cd81a
-0.020
XLOC-004006
0.134
cdkn1ca
-0.020
LOC103908707
0.131
ptmab
-0.020
XLOC-035318
0.131
marcksb
-0.019
si:ch211-1f22.2
0.126
fgfrl1b
-0.019
XLOC-037952
0.124
pltp
-0.019
AL929309.1
0.122
smo
-0.018
LOC101884695
0.121
BX469925.3
-0.018
LOC108179305
0.121
CABZ01075068.1
-0.018
XLOC-034550
0.119
zgc:112356
-0.018
lactbl1b
0.118
cx43.4
-0.018
snx10b
0.118
ptbp1b
-0.018
LOC100333926
0.115
ing3
-0.018
CU467823.1
0.115
tln2a
-0.018
LOC110439864
0.112
rbpjb
-0.018
fyba
0.111
col1a2
-0.018
XLOC-028371
0.107
fzd7a
-0.018
CR383662.5
0.105
oc90
-0.017
btr24
0.104
rasd1
-0.017
BX004857.1
0.103
CABZ01037298.1
-0.017
itln2
0.102
tp53inp2
-0.017
CU928063.1
0.100
si:dkeyp-69c1.6
-0.017
XLOC-016022
0.099
dnmt3bb.2
-0.017
LOC108179227
0.099
hbbe1.3
-0.017
XLOC-030226
0.097
carhsp1
-0.017
mir7149
0.097
fscn1a
-0.017