Daniocell
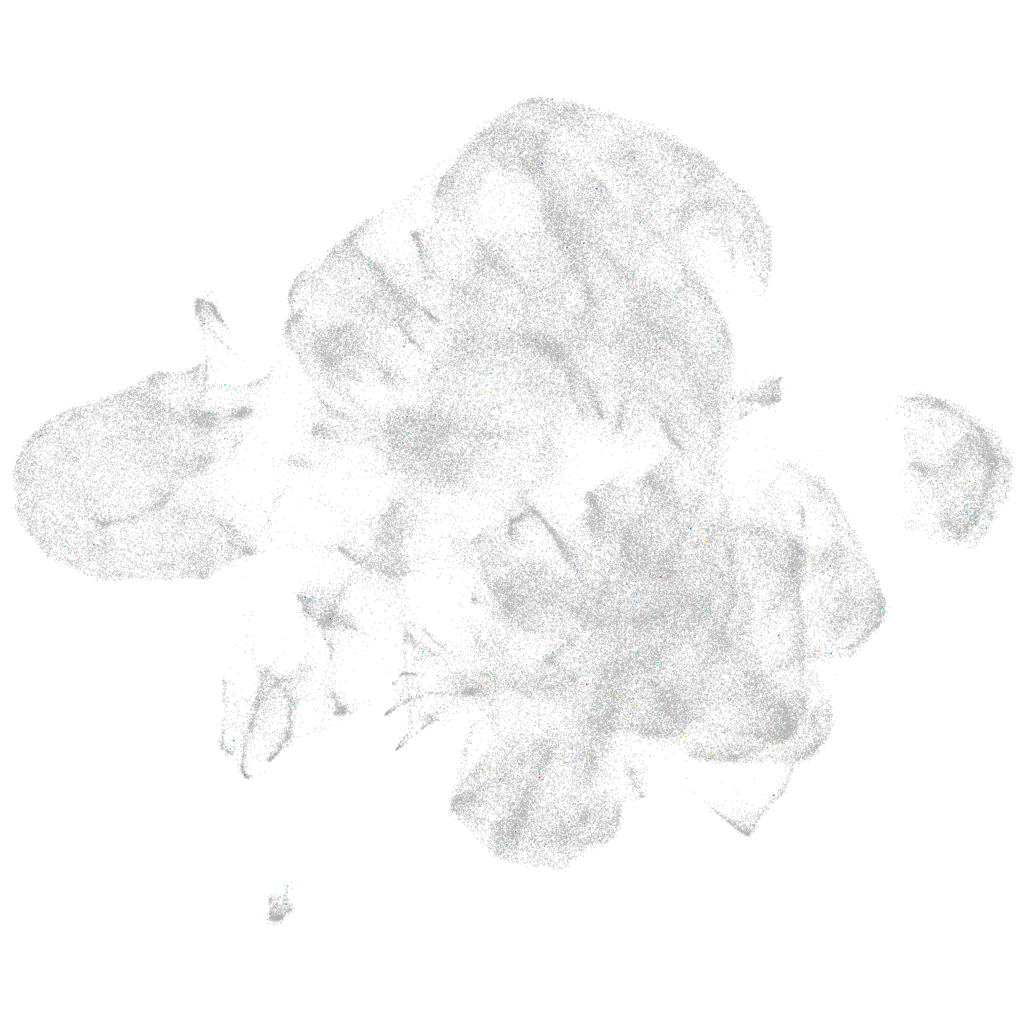
lactb2 (neural)
"lactamase, beta 2"
ZFIN
Gene expression UMAP
Display:
Expression
Stage
Other cell groups
all cells
blastomeres
PGCs
endoderm
axial mesoderm
muscle
mural cells /
non-skeletal muscle
mesenchyme
hematopoietic /
vasculature
pronephros
neural
spinal cord / glia
eye
taste / olfactory
otic / lateral line
epidermis
periderm
fin
ionocytes / mucous
pigment cells
Expression by stage/cluster
Correlated gene expression
Positive correlation
Negative correlation
Gene
r
Gene
r
LOC103911551
0.084
hmga1a
-0.021
si:ch73-366i20.1
0.057
hmgb2a
-0.018
LOC110439442
0.055
si:ch211-222l21.1
-0.014
PEBP4
0.045
tuba8l4
-0.014
zgc:158701
0.044
rps16
-0.014
si:ch211-209n20.59
0.043
snrpd3l
-0.014
megf6a
0.042
si:ch73-281n10.2
-0.014
BX649499.1
0.040
rpl3
-0.014
LOC101884869
0.040
msna
-0.014
kynu
0.038
rps9
-0.013
zgc:64189
0.038
cbx3a
-0.013
XLOC-025051
0.038
seta
-0.013
si:cabz01069015.1
0.037
rps12
-0.012
pcdh20.1
0.036
eef1a1l1
-0.012
AL928908.3
0.035
rps11
-0.012
pxdc1a
0.035
hmgn2
-0.012
ehbp1l1b
0.035
rplp2l
-0.012
si:ch211-149b19.4
0.034
dkc1
-0.012
chmp6a
0.033
nop58
-0.012
si:ch211-272b8.6
0.032
npm1a
-0.012
XLOC-012561
0.032
id1
-0.012
lrrc3ca
0.031
nop56
-0.012
ddx58
0.031
snrpd1
-0.012
si:ch211-38m6.7
0.031
ran
-0.012
pcdh2aa1
0.030
setb
-0.012
mbl2
0.030
selenoh
-0.012
hhla2b.2
0.030
hmgb2b
-0.012
XLOC-016189
0.029
pcna
-0.012
ddr2b
0.029
rpl12
-0.012
fam78ab
0.029
si:dkey-151g10.6
-0.011
BX248511.1
0.029
snu13b
-0.011
il4
0.028
rplp1
-0.011
kcnk17
0.028
anp32b
-0.011
LOC108180211
0.028
ssrp1a
-0.011
LOC110438012
0.027
mki67
-0.011